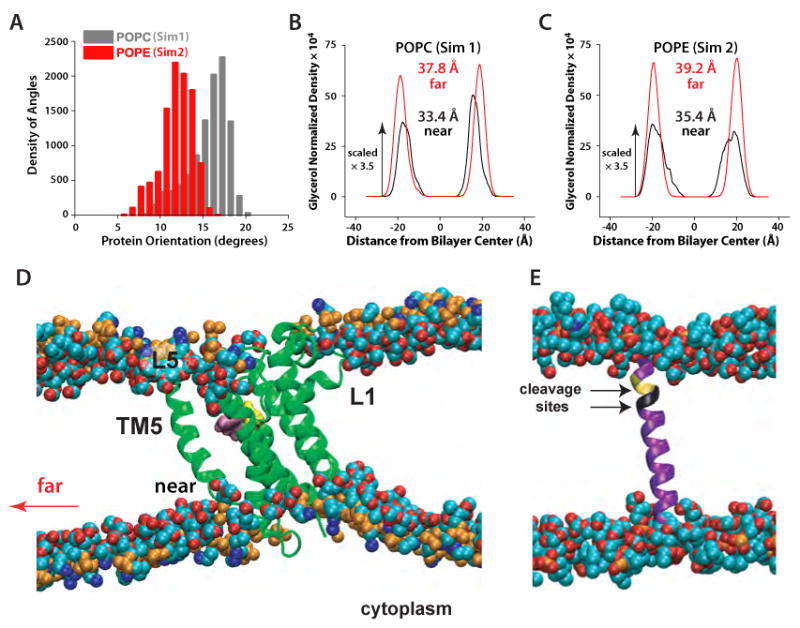
Figure 2.

Local perturbations of lipid bilayers caused by GlpG rhomboid protease. (A) Distribution of orientational angles of GlpG relative to the membrane normal in Sim1 (gray) and Sim2 (red). (B) Hydrocarbon thickness of the POPC bilayers (Sim1) and (C) POPE bilayers (Sim2) close to the protein (black curves; computed from ∼90 lipids within the first 2-3 shells of lipids around the protein) and far from the protein in the unperturbed region of the bilayer (red curves). The hydrocarbon thickness was estimated as the distance between the peaks of the distribution for the glycerol groups of the two lipid leaflets (Wiener and White, 1992) taken along the membrane normal and normalized by the volume of the simulation cell. In the case of the distorted density peaks for POPE lipids close to the protein (z ∼20Å), we used the value of z at the center of the distribution. (D) Thinning of the lipid bilayer close to the protein; only a ∼38 Å-wide section of the bilayer containing the protein is depicted. (E) Snapshot of the Spitz substrate in a POPC lipid bilayer. The two substrate cleavage sites (Baker et al., 2007) are shown in yellow (Ala-Ser) and black (Gly-Ala). Little perturbation of the bilayer in the vicinity of Spitz was observed.
