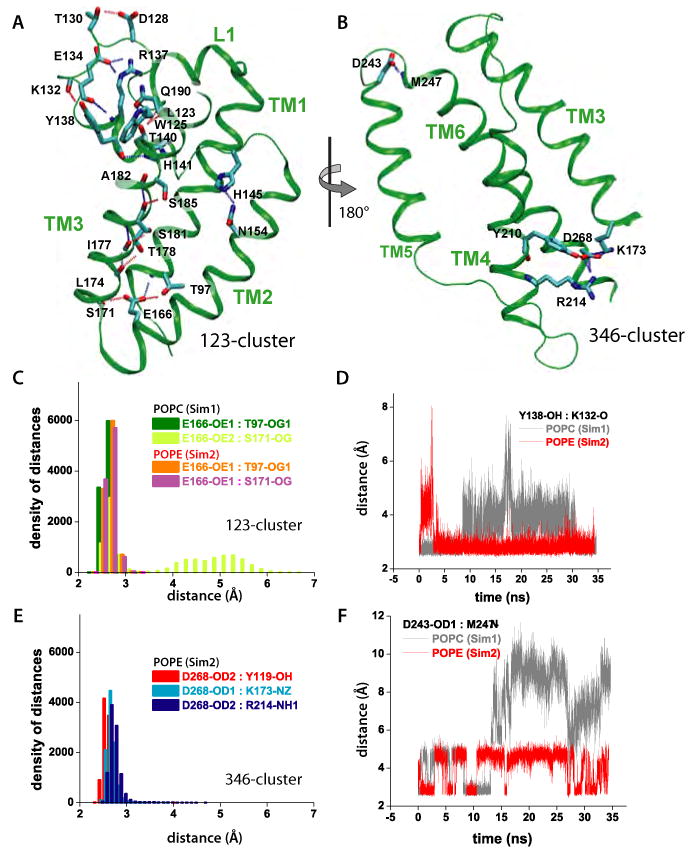
Figure 5.

Intra-protein H-bonding of GlpG. (A) H-bonding within L1 and TM1/TM2/TM3 (123-cluster). (B) H-bonding within TM3/TM4/TM6 (346-cluster). For simplicity, only the backbone carbonyl or amide groups are depicted for non-polar residues. (C) Histograms of H-bonding distances in the 123-cluster for POPC and POPE. The E166-S171 H-bond breaks and reforms in POPC. (D) Effect of lipid-type on the dynamics of the Y138-K132 H-bonding in the 123-cluster. (E) Histograms of H-bonding distances within the 346 cluster in POPE. The histograms for the 346-cluster are very similar for POPE and POPC (data not shown). (F) Dynamics of H-bonds in the lipid interface of L5 depend upon lipid type.
