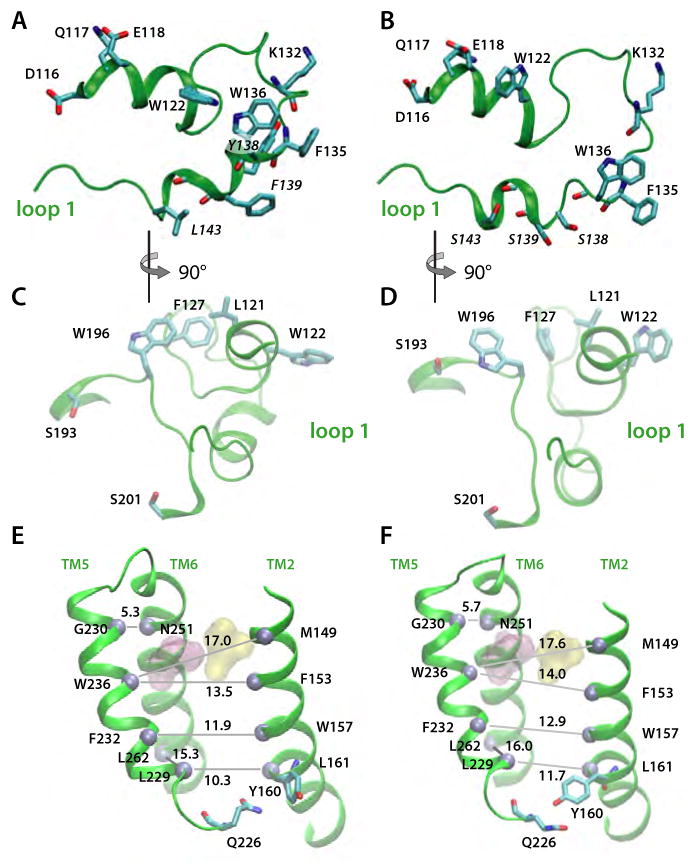
Figure 6.

Simulation snapshots illustrating relay of Loop L1 perturbations to the substrate access site in the triple-Ser mutant (Y138S/F139S/L143S). Snapshots of the wild-type and mutant conformations are shown in the left-hand (A,C,E) and right-hand (B,D,F) panels, respectively. (A) Periplasmic view of L1 in the wild-type protein. All distances are in Å. (B) Periplasmic view of L1 in the triple-Ser mutant. (C). View of wild-type L1 viewed from the active site. site in the wild-type protein (D) View of triple-ser L1 from the active site. (E) Mean spacing between selected Cα atoms (gray spheres) in TM2/TM5/TM6 for the wild-type protein. (F) Mean Cα spacings for triple-Ser mutant. For panels E and F, the standard deviations of the distances are ≤ 0.6Å.
