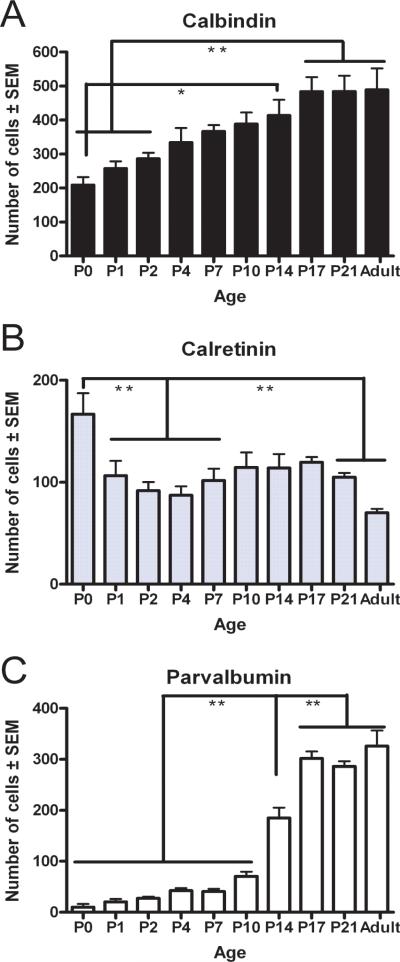
Fig. 6. CaBP numbers within the rat S1 cortex follows a developmental pattern.
Cells positive for each marker were counted and expressed as mean positive cells/section (± SEM; Methods). Cells positive for CB (A), CR (B) or PV (C). Statistical differences determined by ANOVA, using a Bonferroni post-test comparison of means (*p<0.05, **p<0.01, all other comparisons were not significant).

