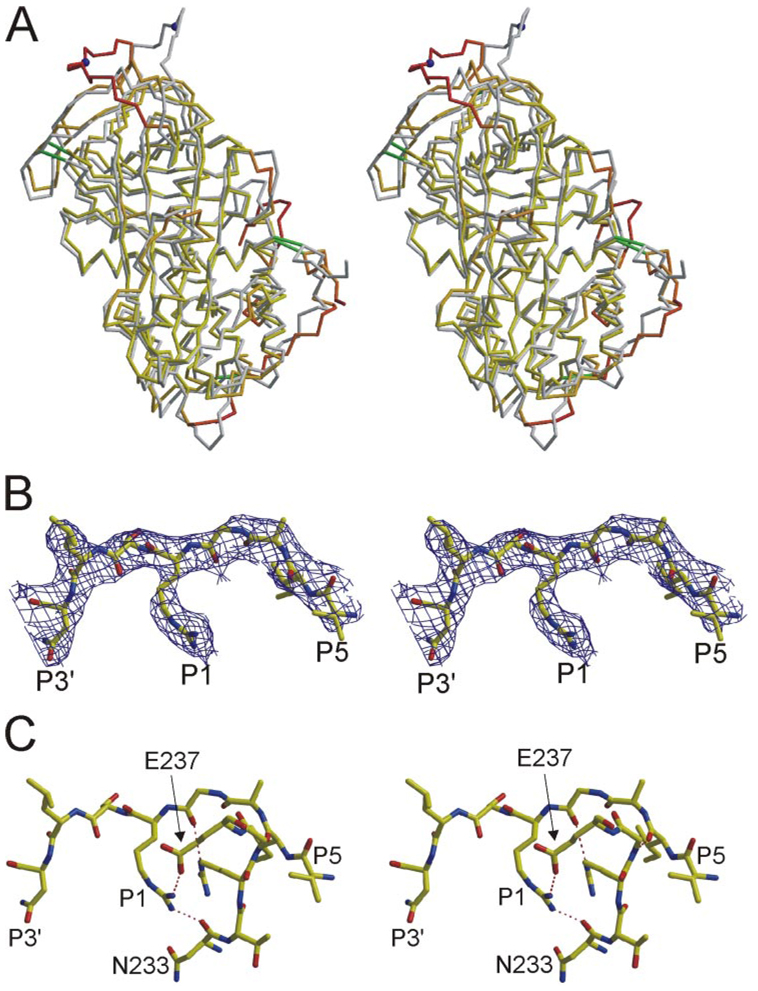
FIGURE 3. Stereo views of the structure of monomericATreveals a novel RCL conformation and contacts.
A, superimposed Cα traces of native AT from crystals of the heterodimer (gray) and of monomeric AT (oriented as in Fig. 1A) reveal regions of conformational difference. Monomeric AT is colored according to Cα root mean squared deviation (yellow to red, from 1 to 6 Å) with the active component of 1E04 (β-glycoform). Disulfide bonds are shown as green rods, and the P1 residue is indicated by a blue ball. Regions that differ most significantly are the RCL (top) and the heparin binding site (lower right). B, the RCL of monomeric AT (from P5 to P3′) is shown with corresponding electron density (contoured at 1σ). C, extensive intramolecular contacts are observed between the RCL and the body of AT; those involving the P1 Arg-393 are indicated by dashed lines.

