
Figure 2. The relationship between brain size and cranial size for an intraspecific ‘ontogenetic’ model of dwarfing.
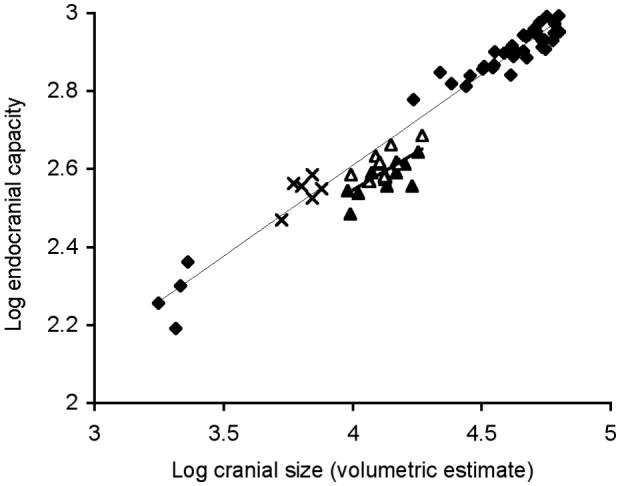
Major axis slopes and 95% confidence intervals: H. amphibius 0.468 (0.44 - 0.50) thin line, dwarf species pooled 0.454 (0.27 - 0.67) bold line. H. amphibius (filled diamonds; n = 37), H. lemerlei (filled triangles; n= 12), H. madagascariensis (open triangles; n = 12), C. liberiensis (crosses; n = 6). For statistical comparisons see Supplementary Table 1.