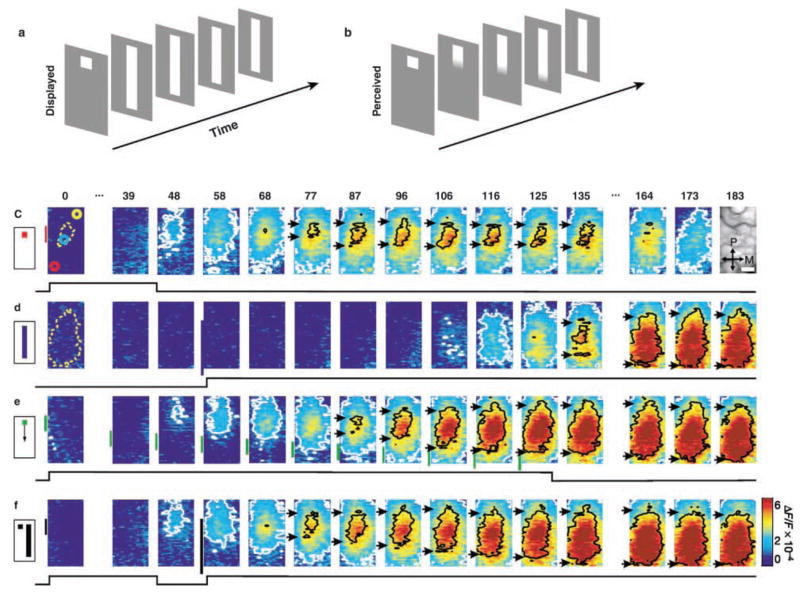
Fig. 7.
Propagating waves may contribute to the perception of visual illusion. Cortical representations of stationary, moving, and illusory moving stimuli. The line-motion illusion. (a) Square (“cue”) presented before a bar stimulus. (b) Subjects report illusory line drawing. (c–f) Patterns of evoked cortical activity as a function of time. Yellow dotted contours approximate retinotopic representation of the stimuli; white contours delimit low-amplitude activity (significance level, P < 0.05). The cortical area imaged is shown at upper right. Scale bar, 1 mm. P = posterior; M = medial. Green vertical lines in e indicate estimated position of the stimuli along posterior–anterior axis. Time in milliseconds after stimulus onset is shown at the top. Stimulation time is shown at the bottom of each row. Color scale indicates averaged fractional changes in fluorescence intensity (F/F). Stimuli: c = flashed small square; d = flashed bar; e = moving small square (32° s-1); f = line-motion paradigm. A total of 22 repetitions were averaged. (Reprinted from Jancke and others 2004, with permission from Nature.)

