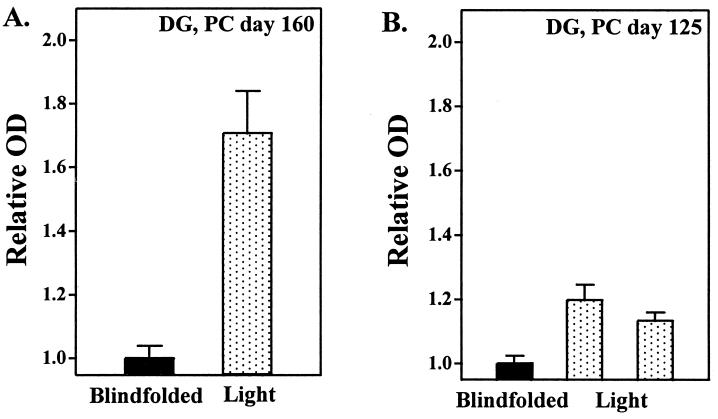
Figure 2.
Relative OD values of individual animals generated from DG-uptake studies at PC days 160 (A) and 125 (B). Animals were exposed directly (dotted bars) or blindfolded (black bars) during exposure to 5,000 lux of light. Relative OD values are means ± SEM of three determinations at mid-SCN level per animal.

