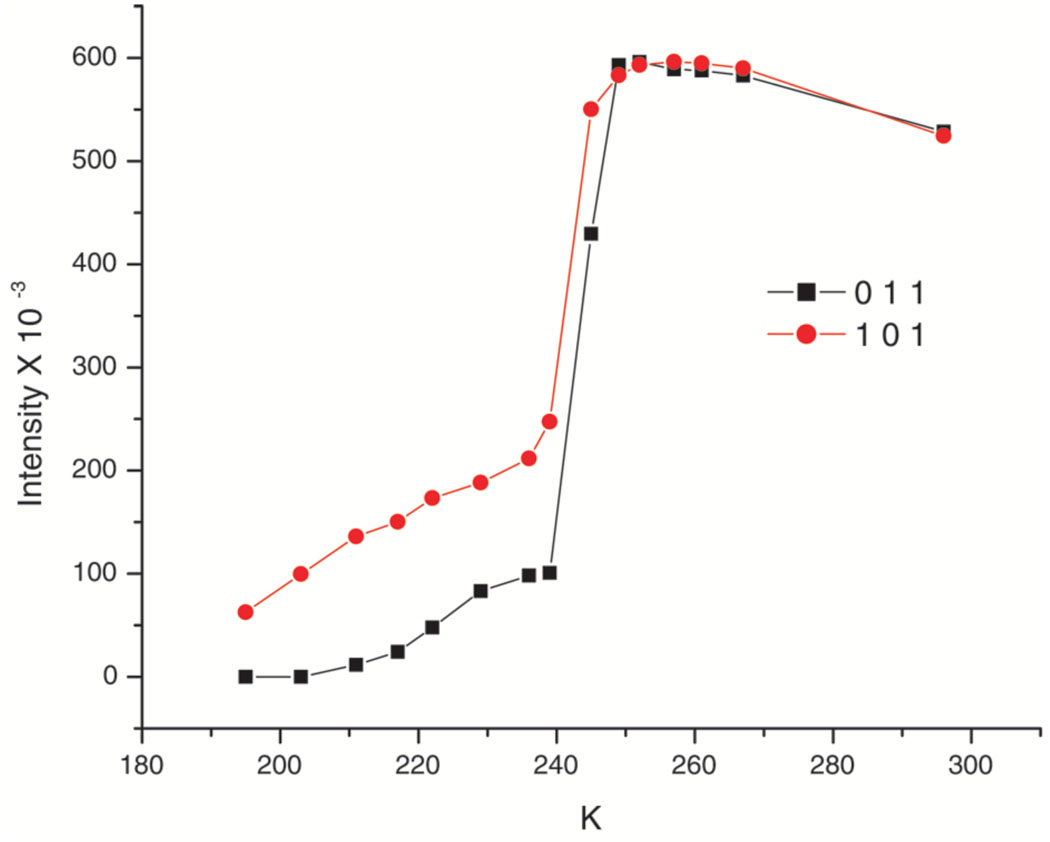
Figure 6.
A plot of measured intensities on a single crystal of Fe(TPP)(NO). Above the transition point the reflections (0 1 1) and (1 0 1) are Laue equivalents in the tetragonal cell and the quality of the data sets for the two phases appear similar. They become inequivalent at the phase change near 24 °C. The decrease in the intensities at the higher temperature can be ascribed to the effects of thermal motion.

