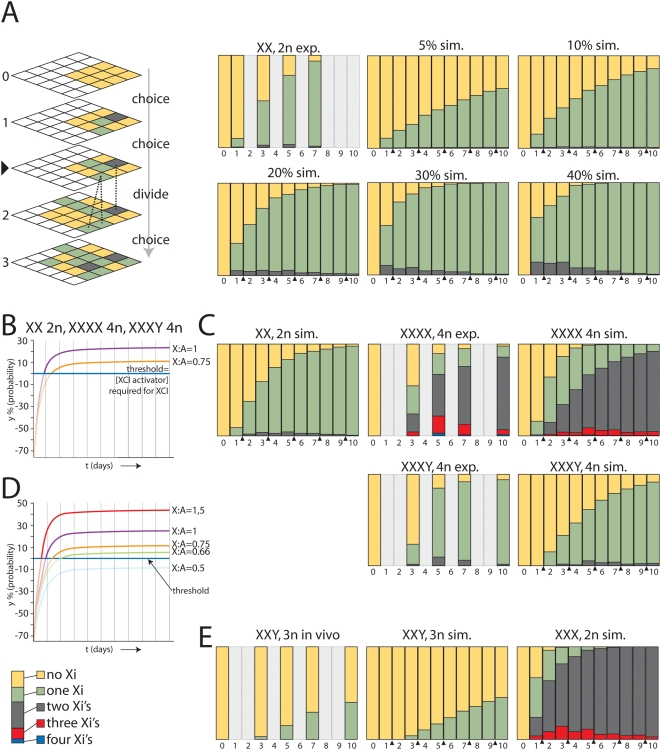
Figure 4. Computer simulation of XCI.
A) Left upper panel shows a schematic representation of the stochastic simulation which is executed in a three dimensional matrix. Cells (boxes) go through consecutive choice rounds (numbers) interrupted by cell divisions (triangle). The three different cell types are represented by XaXa = yellow, XiXa = green, XiXi = gray boxes. The dashed lines indicate the origin of progeny of one XiXa and one XiXi cell after cell division (not all lines are shown, and note that the XiXi cells do not divide). The right panels show the experimental data from differentiated 2n female XX ES cells (exp.), and the stochastic simulation of XCI with a 5%, 10%, 20%, 30%, and 40% fixed probability per X chromosome (sim.). The different bar-graphs show the relative distribution of the three different cell types (XaXa = yellow, XiXa = green, XiXi = gray). Numbers below the bar graphs indicate days of differentiation (1–10), and cell division is indicated with a triangle. For time points represented by light gray bars no data is available. B) Probability curves representing the increase of the probability y in time based on equation [6], with m = 1, for XX 2n and XXXX 4n cells (purple), and m = 0,75 for XXXY 4n cells (orange). The probability at a given time point is the integrated probability over a time frame of one day. A negative value for y results in a probability of 0, and is represented by a faint line. C) Upper left panel shows simulation of XCI in XX diploid cells based on probabilities determined using different probabilities in time indicated in the curve, shown in (B). Upper middle panel shows the experimental percentages of 4n XXXX cells with a different number of Xi's throughout EB differentiation. The upper right panel shows the simulation of XCI using the same parameters as used for the XX diploid simulation (XaXaXaXa = yellow, XaXaXaXi = green, XaXaXiXi = grey, XaXiXiXi = red, XiXiXiXi, blue). Bottom left panel shows the experimentally determined percentages of 4n XXXY cells with a different number of Xi's throughout EB differentiation. Bottom right panel shows the XCI simulation of 4n XXXY cells using the different probabilities in time indicated in the curve presented in (B) (XaXaXaY = yellow, XaXaXiY = green, XaXiXiY = grey, XiXiXiY = red). D) Curves representing the probability y in time using equation [6] for cells with a different X∶A ratio, ranging from 0,5 to 1,5. E) Left panel shows the experimentally determined percentages of 3n XXY cells with a different number of Xi's throughout EB differentiation. Middle panel shows the XCI simulation of 3n XXY cells using different probabilities indicated in the curve presented in (D) (XaXaY = yellow, XaXiY = green, XiXiY = grey). Right panel shows the simulation of XCI in XXX 2n cells (XaXaXa = yellow, XaXaXi = green, XiXiXa = grey, XiXiXi, red).

