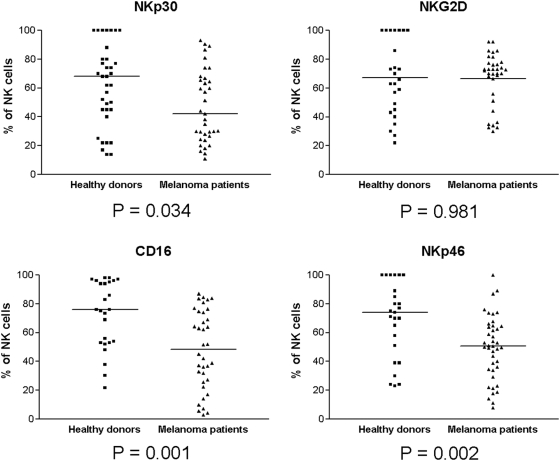
Figure 6. NK NKLR expression profile in healthy donors vs. melanoma patients.
The expression profile of each NKLR is presented in an independent panel, as indicated. Each dot represents either a healthy donor or a melanoma patient. Blood specimens were collected from 30 healthy donors and 40 stage IV melanoma patients with clinical evidence of disease. Y-axis denotes the percent of NKLR-positive cells out of gated NK cell. Horizontal lines represent median values. P value under each panel was calculated with an aparametric t-test and represents the statistical significance of the difference between median values.

