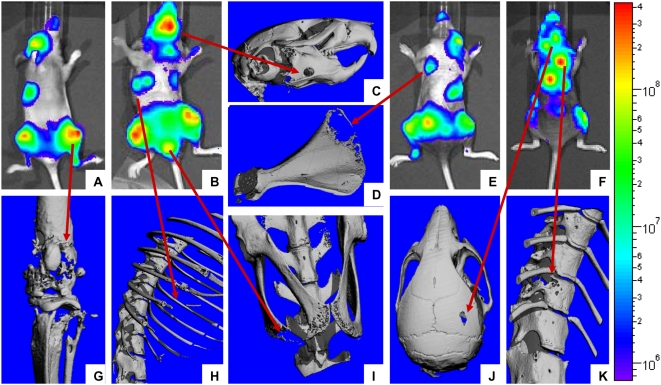
Figure 4. Correlation between tumor bioluminescence and osteolytic lesions.
Representative bioluminescence images (A, B, E, F) and corresponding 3D μCT reconstructions for some of the most common skeletal sites of bone metastases in NIH-III mice following intracardiac injection of MDA-MB-231-Luc2 cells: jaw (C), scapula (D), knee (G), ribs (H), pubis/ischium (I) parietal bone of the skull (J), and thoracic spine (K). Scale bar on the right of images represents intensity of bioluminescence in photons/s/cm2.

