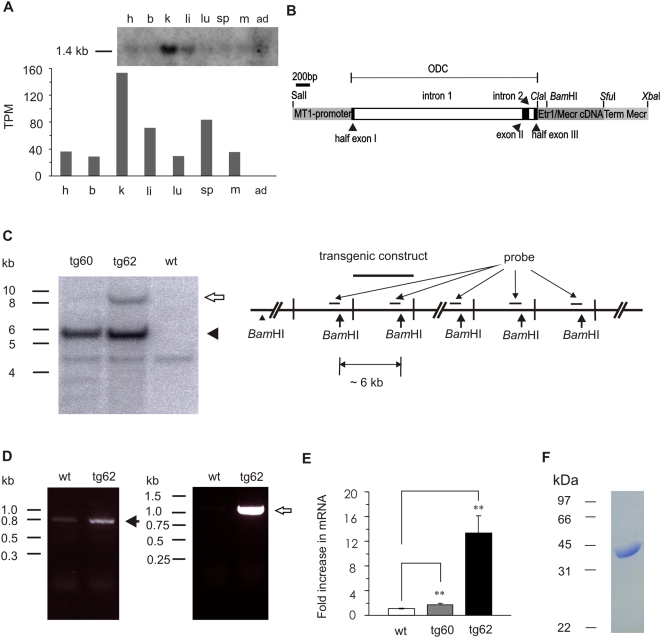
Figure 1. The generation of Mecr transgenic mice.
A. Tissue expression pattern of Mecr in mice. The upper panel showed result of Northern blot. The lower panel showed the in silico analysis of Mecr expression pattern estimated from EST sources (UniGene, NCBI). The number indicated in y-axis refers to transcripts per million (TPM) that was calculated by the number of gene EST divided by totoal EST in pool of the indicated tissues. The symbol h, b, k, li, lu, sp, m, and ad refer to heart, brain, kidney, liver, lung, spleen, muscle, and adipose tissue, respectively. B. Transgenic construct consisting of the MT-1 promoter driving mouse Mecr expression; a 5′ noncoding region of the human ODC gene which includes the first two introns; full length mouse Etr1/Mecr cDNA including the translation initiation codon (ATG) and the stop codon in frame; followed by the 3′ UTR and termination signal of the mouse Mecr gene (Term. Mecr). C. Southern blot genotyping, schematic presentation of the integration of the Mecr transgenic construct into the mouse genome. Mouse genomic DNA was digested by BamHI, giving a 6 kb fragment which is a marker for the transgene construct. The arrow head showed the size of the transgene construct (∼6 kb); the unfilled arrow shows an additional 9.5 kb fragment recognized by the probe only in tg62. The greater intensity of the 6 kb transgene band over that of the single-copy wild type band seen at approximately 4.3 kb in all three DNA samples demonstrates integration of multiple copies of the construct. The 9.5 kb signal arises from the 5′ end of the construct together with about 3.5 kb from the integration site. D. Reverse template PCR analysis of Mecr expression levels. Oligonucleotides which can recognize Mecr mRNA were used in left picture. The solid arrow shows an 800 bp band that was detected both in wild type and Mecr transgenic samples. Transgenic construct specific oligonucleotides were used in right picture. The unfilled arrow shows a 1.2 kb band detected only in Mecr transgenic samples. E. Real time PCR analysis of Mecr expression levels. Results are expressed as mean±SD (n = 4) **P<0.01 Mecr transgenic mice vs. wild type control. F. SDS-PAGE analysis of the purified His6-tagged Etr1/Mecr protein. The visualized band at 37 kDa corresponds to the predicted size of the peptide chain expressed from E. coli.

