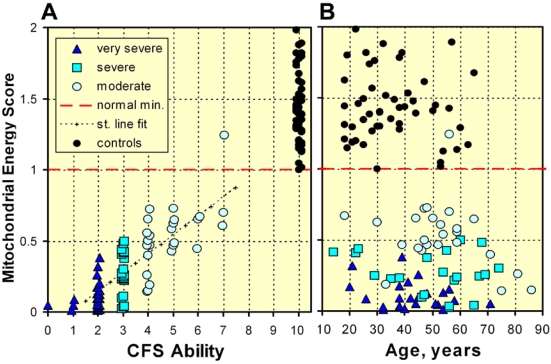
Figure 4.
The Mitochondrial Energy Score. A. The Energy Score plotted against CFS Ability with a point for each patient. A point for each control is plotted at CFS Ability = 10. The horizontal dashed line at Energy Score = 1.00 is our normalisation at the minimum Energy Score for controls. Also shown is the best straight line fit to the patient data. B. The Energy Score plotted vs. Age of patients and controls.

