
Figure 5.
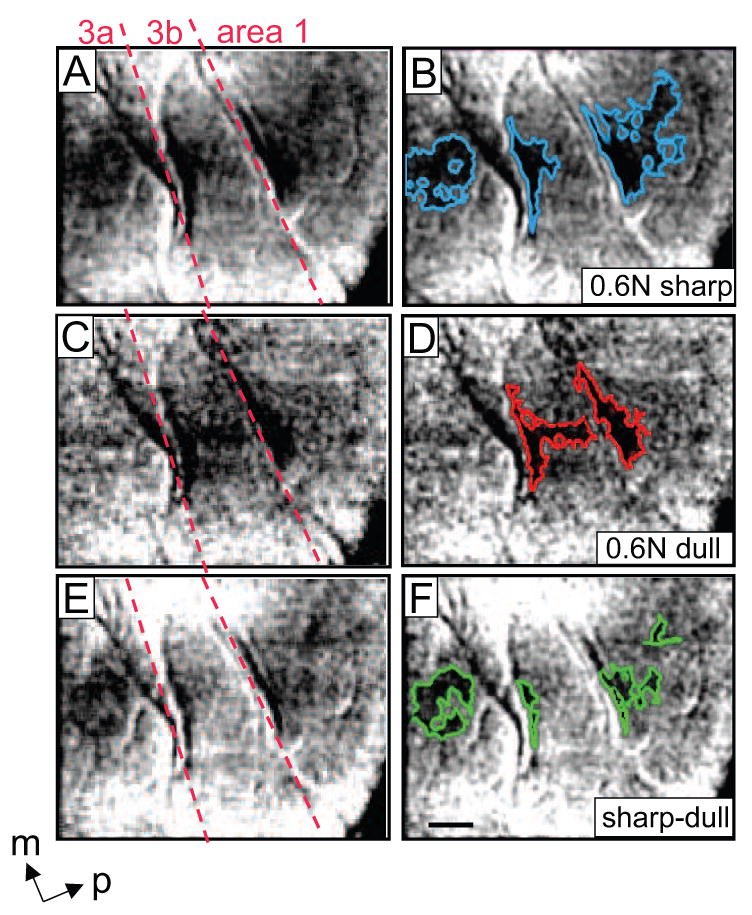
Different activation patterns were evoked with pressure and the sharp nociceptive probe in SI. Case 1. Moderate (0.6 N) indentations of the 0.2 (nociceptive) and 2 mm (pressure) diameter probes were presented to the D3 distal fingerpad. A-D) Single condition maps showing the focal and spatially distinct activations in areas 3a, 3b and 1 in response to the nociceptive stimulus (A, B) and pressure stimulus (C, D). Activation areas are outlined in blue (B) and red (D). E and F: Subtraction maps (sharp minus dull). C, D) regions exhibiting preferential activation to the sharp probe are outlined in green (F). Nociceptive stimulation produced activation in areas 3a, 3b and 1, whereas pressure elicited activation only in areas 3b and 1. Images were summed over 30 trials. Scale bar = 1 mm. M = medial, p = posterior. Red dotted lines: approximate borders between Areas 3a, 3b, and 1 were determined from the neuronal response properties obtained from electrode mapping SI in this animal.