
Figure 6.
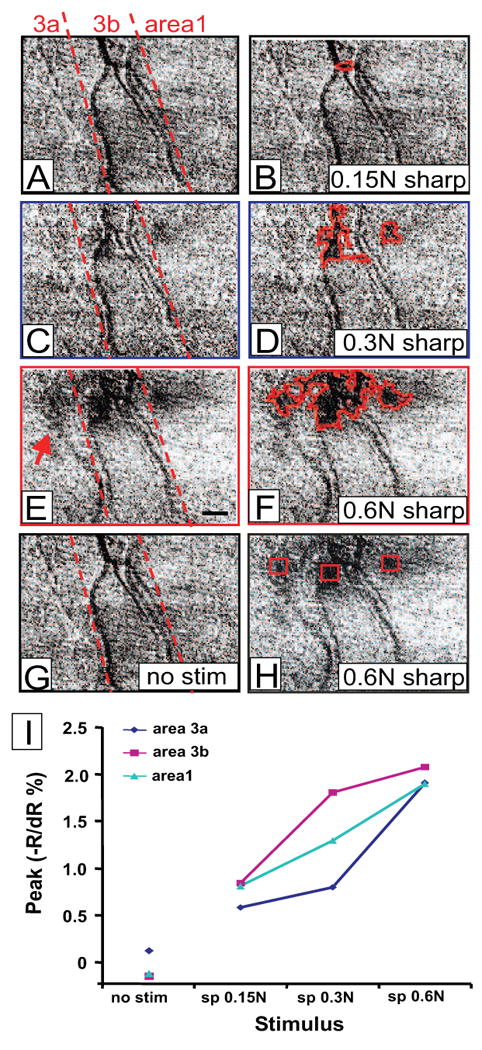
Cortical responses to increased intensity of mechanical painful stimuli in areas 3a, 3b and 1. Activations evoked with: (A, B) 0.15 N sharp probe, (C, D) 0.3 N sharp probe, and (E, F) 0.6 N sharp probe, and (G) blank. Activations outlined on left (B, D, F). H) Regions of interest (red boxes) in areas 3a, 3b and 1 indicated on (E) map. Dashed lines in A, C, and E: approximate borders of somatosensory areas. (I) Plot of peak reflectance change with indentation force (sharp probe 0.6N: moderately nociceptive; 0.3N: weakly nociceptive, and 0.15 N sharp probe: weak pressure) for areas 3a (blue), 3b(pink) and 1(aqua blue). Scale bar: 1mm.