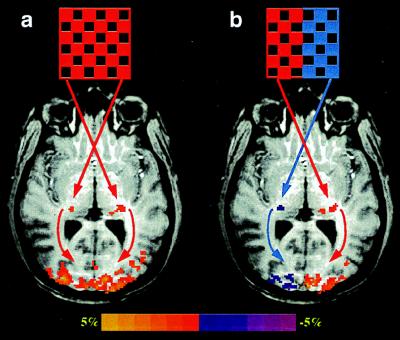
Figure 2.
fMRI mapping of the LGN and V1 activation from subject 2 during the left–right hemifield visual stimulations from a different experimental session and the axial image orientation. (a) LGN activation maps generated from the full-field visual stimulation. (b) LGN activation maps generated from the alternating left and right hemifield visual stimulation. The colors red and purple in b indicate the LGN activation pixels that responded to the right and left visual hemifield stimulation, respectively. Arrows show the visual pathway from retinas to LGN and from LGN to V1 in the human brain.

