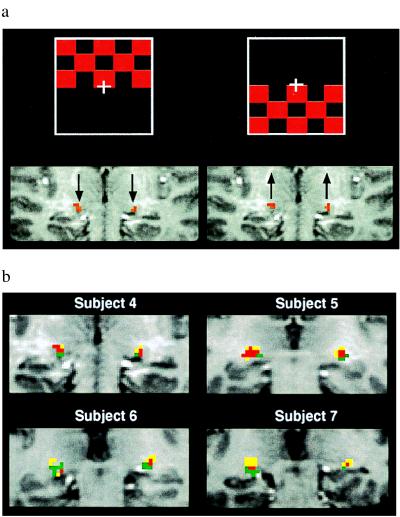
Figure 3.
fMRI mapping of the LGN activation during the upper-field and lower-field visual stimulations (coronal image orientation). (a) fMRI maps generated from the upper-field visual stimulation (the left fMRI map and the upper red checkerboard inset) and from the lower-field visual stimulation (the right fMRI map and the lower red checkerboard inset) of a representative subject (subject 4). Arrows show the vertical direction of spatial shifting of the LGN activation during the upper-field and lower-field visual stimulation, respectively. (b) Composite fMRI maps of the LGN activation from four subjects obtained by combining the two activation maps generated from the upper-field and lower-field visual stimulations relative to a dark control state. Green and yellow pixels represent the LGN activation pixels induced by the upper-field and lower-field visual stimulation, respectively. Red pixels represent the overlap LGN activation pixels between the upper-field and lower-field visual stimulations.

