Fig. 7.
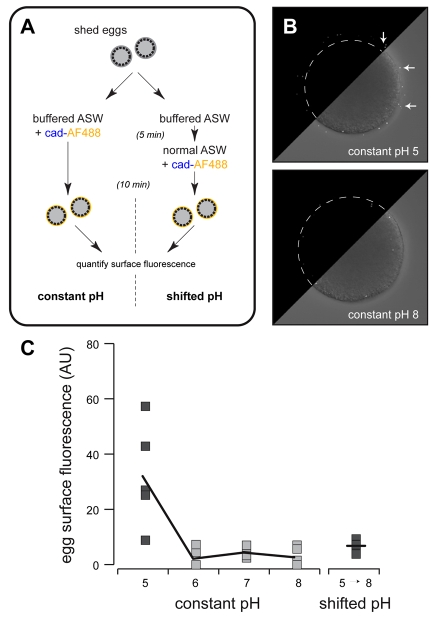
Acidic environments support transamidation. (A) Protocol used to test pH dependency of transamidation. Normal ASW is ∼pH 8. (B) Composite images represent individual eggs treated at pH 5 (top) and pH 8 (bottom). Upper left corner of each image shows fluorescence signal, whereas lower right corner is an overlay of fluorescence signal (white) over DIC image. Egg plasma membrane is outlined in fluorescence-only corners. Arrows indicate extracellular signal; most signal from pH 8 eggs is cytoplasmic. (C) Quantification of surface fluorescence in response to constant pH exposure or rapid alkalination from pH 5 to pH 8. Results from individual eggs are shown, with the averages per treatment connected by lines (n=5-8 eggs per pH, per condition). pH 5 results are significantly different than each other treatment (P≤0.01).

