
Fig. 4.
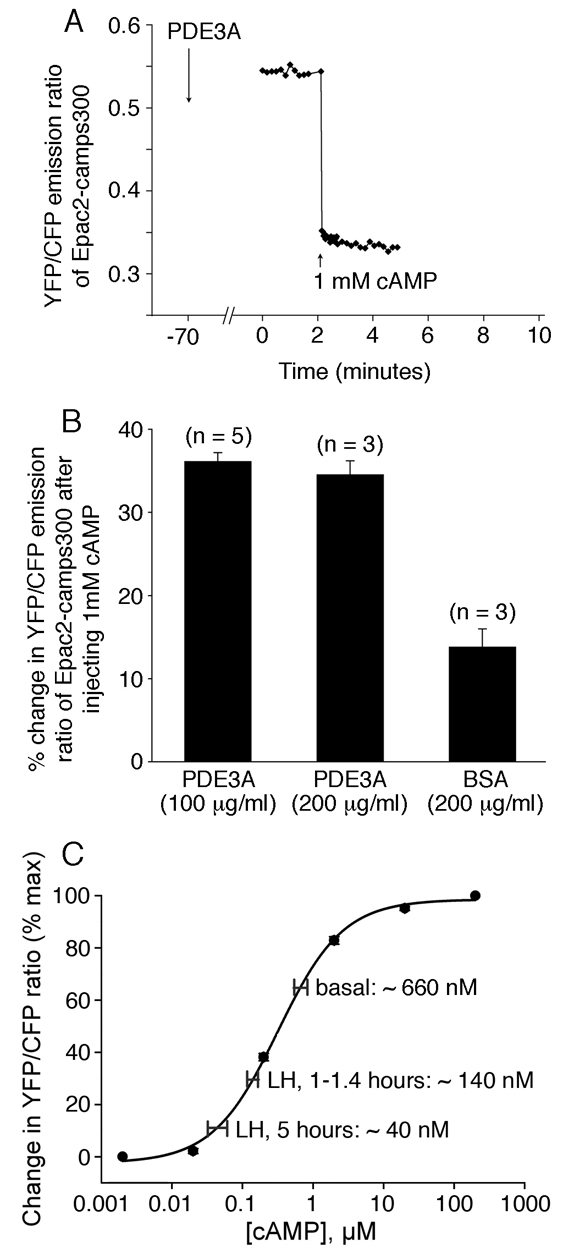
Calibration of the cAMP concentrations in follicle-enclosed oocytes with or without LH treatment. (A,B) Determination of the percentage change in the YFP/CFP emission ratio for Epac2-camps300 in going from a minimum to a maximum cAMP concentration in vivo. (A) Record from a follicle-enclosed mouse oocyte that was injected with 5 μM Epac2-camps300 plus 100 μg/ml PDE3A catalytic domain (to lower cAMP to a minimum level), and then ∼1 hour later injected with 1 mM cAMP. (B) Percentage change in YFP/CFP emission ratio in follicle-enclosed oocytes injected with PDE3A, or BSA control, and then ∼1 hour later injected with 1 mM cAMP. Injection of 100-200 μg/ml PDE3A lowered the YFP/CFP emission ratio by 35.5±1.0% (n=8). (C) cAMP concentrations in follicle-enclosed oocytes with or without LH treatment, as calculated using the in vitro concentration-response curve for Epac2-camps300 (replotted here from Fig. 1B), the 35.5% value for the maximum change in YFP/CFP emission ratio for Epac2-camps300 in vivo (A,B), and the data presented in Fig. 3. The following example illustrates how these calculations were made. For the measurement shown in Fig. 3A, the change in YFP/CFP emission ratio in going from the baseline level to that after injecting 1 mM cAMP was 14%. Using the percentage change in YFP/CFP ratio over the dynamic range of the sensor in vivo, shown above to be 35.5%, we calculated the percentage change in YFP/CFP ratio corresponding to a change from ∼0 mM cAMP to the baseline cAMP level in Fig. 3A: 35.5-14=21.5%. 21.5/35.5=61% of the maximum change in YFP/CFP ratio over the dynamic range of the sensor. 61% on the y-axis of Fig. 4C corresponds to 540 mM cAMP on the x-axis, as determined using Origin software. The horizontal bars in C represent the mean±s.e.m. for the cAMP concentrations calculated for the sets of measurements summarized in Fig. 3D. Basal, 660±110 nM (n=15); 1-1.4 hours, 140±18 nM (n=18); 5 hours, 43±17 nM (n=5). The cAMP concentrations at 1-1.4 and 5 hours after LH are significantly different from the basal value (P<0.0001 and P=0.005, respectively), and from each other (P<0.01).