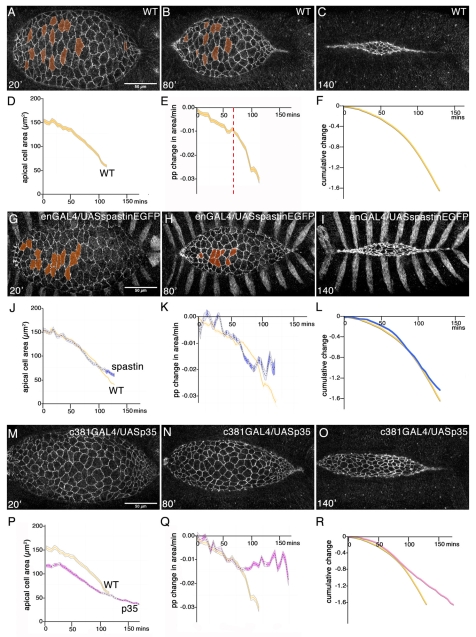
Fig. 1.
Dynamics of amnioserosa contraction in pooled wild-type and mutant Drosophila embryos. (A-C,G-I,M-O) Still images from a time-lapse movie of a wild-type embryo (A-C; see Movie 1 in the supplementary material), an enGal4/UAS-spastin-EGFP embryo (G-I; see Movie 2 in the supplementary material) and an ASGal4/UAS-p35 embryo (M-O; see Movie 3 in the supplementary material), carrying the ubiECadGFP transgene at 20, 80 and 140 minutes after the start of dorsal closure (DC), defined as the onset of amnioserosa (AS) contraction. Anterior is to the left in these and all subsequent images. Cells that undergo basal extrusion (before being reached by the zippering epidermis) are labelled in red. (D-F) Data are pooled from four wild-type embryos (orange ribbons). Staging of embryos was by comparing the morphogenesis of the posterior spiracles. (J-L) Data are pooled from four different enGal4/UAS-spastin-EGFP embryos (blue ribbons). (P-R) Data are pooled from three different ASGal4/UAS-p35 embryos (magenta ribbons). For the shading code of the ribbons, see Materials and methods. (D,J,P) Mean apical cell area. (E,K,Q) Proportional rate of change in apical area of AS cells. In E, the transition from the slow phase (0-70 minutes) to the fast phase (70 minutes to end) is highlighted (dashed red line). (F,L,R) Cumulative proportional area change. Data from single embryos are shown in Fig. S1 in the supplementary material. Fluctuations in contraction rates in K and Q are considered to be noise due to experimental error and enhanced variability in the phenotype of mutant embryos (developmental timings are known to be more variable between mutants than between wild-type embryos). Although fluctuations in apical cell area do exist at early stages of development (data not shown), they occur on a smaller time scale than those shown in these graphs.

