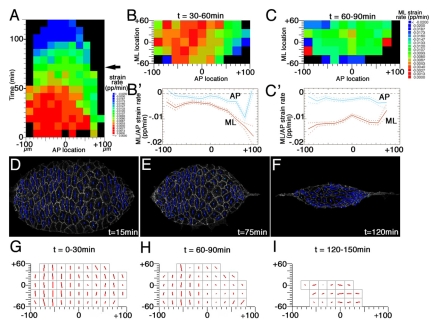
Fig. 4.
Differences in cell behaviour along the AP axis in wild-type Drosophila embryos. (A) Proportional change in area/minute (area strain rate) of AS cells as a function of their AP location over time. The arrow indicates the transition between the slow and the fast phases. (B,C) Mean proportional rates of change in the ML orientation for cells across the AS for the periods 30-60 minutes and 60-90 minutes after the start of dorsal closure, respectively. Colours represent the mean behaviour of cells that fall within each tile of AS tissue. (B′,C′) The same data as in B,C are presented as averages over the ML (red) and the AP (light blue) axis, for the same periods of DC. Data are pooled from four wild-type embryos in all graphs. (D-F) Still images from an animation of an example wild-type embryo, showing the relative magnitude and orientation of the long axis of AS cells. (G-I) Cell orientation data are pooled from four aligned wild-type embryos, and regional averages are shown for three epochs of DC: 0-30, 60-90 and 120-150 minutes after the onset of DC. The orientation of the red lines represents the mean (elongation ratio-weighted) orientation of the long axis of cells in each grid square. The lengths of red lines represent the elongation log-ratio of the long to short axes of cell shapes. A line length equal to the size of a grid square equals a log-ratio of 1.0 (a ratio of 2.718:1).

