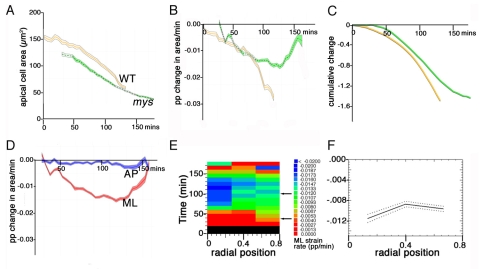
Fig. 7.
Dynamics of AS contraction in mys mutant Drosophila embryos. (A) Mean apical cell area. (B) Proportional change in apical area. (C) Cumulative proportional area change. Data are pooled from four aligned mys embryos (green ribbons), with wild-type (orange) and ASGal4/UASp35 (magenta) ribbons presented as in Fig. 1. Both ASGal4/UASp35 and mys embryos lack a fast phase of AS contraction (B). (D) Proportional rates of size change of AS cells in ML (red) and AP (blue) orientations for data pooled from four mys embryos. (E,F) The radial pattern of ML-oriented cell shape strain rates is shown as in Fig. 4 for pooled mys data. Central cells contract their apical surface area in the ML orientation faster than peripheral cells during the period of 40-100 minutes.

