
Figure 1.
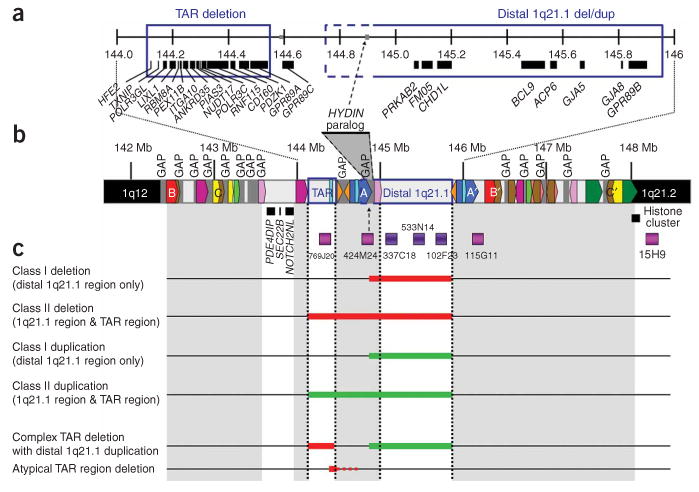
Schematic representation of chromosome 1q21.1 based on the March 2006 freeze of the reference human genome sequence (NCBI build 36.1) and summary of molecular findings. (a) An enlargement of the region between 144 and 146 Mb. Known genes are indicated by black bars. (b) The region from 142 to 148 Mb. The minimal regions for the TAR syndrome deletion and the distal 1q21.1 deletion/duplication are shown with blue boxes. Array-CGH clones are shown in dark violet, and additional FISH clones used during the course of the study are shown in magenta. Gaps in the reference sequence are indicated by gray breaks in the chromosome bar. The putative location of the HYDIN paralog is indicated by a gray triangle bounded by dashed lines. Regions of segmental duplication are depicted by colored boxes. A pair of large, directly oriented intrachromosomal repeats flanks the distal 1q21.1 region (blue blocks labeled A and A′). In addition, there is another pair of directly oriented repeats flanking the first ∼4 Mb of the sub-band and encompassing both the TAR region and the distal 1q21.1 region (red blocks labeled B and B′). Finally, there is a pair of blocks flanking a large portion of the sub-band 1q21.1 (yellow blocks labeled C and C′), in opposite orientation. Several other blocks are present, but gaps in the reference sequence preclude further detailed characterization at this time. (c) Overview of the deletions and duplications in affected individuals described in this report. Thick red horizontal lines indicate minimally deleted regions, whereas thick green horizontal lines indicate minimally duplicated regions. The complex deletion/duplication rearrangement in individual 36 is depicted with red and green bars, and the single case with atypical TAR region deletion is indicated with a solid red and dashed red line (see text for details).