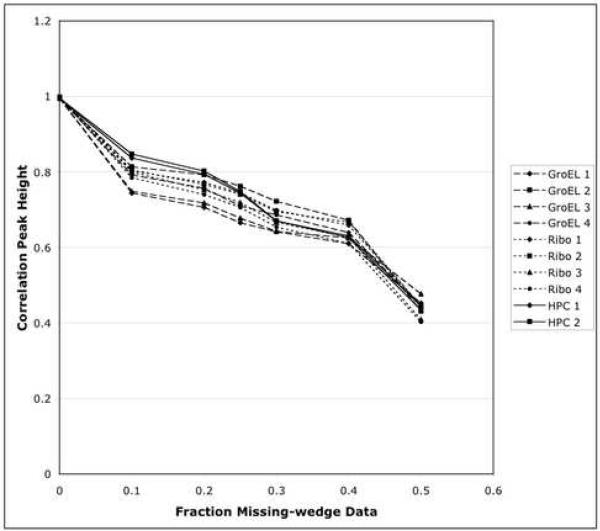
Figure 3.
Plot of cross-correlation peak height as a function of fraction of missing data, as in Figure 2, except that all the data used for this study is plotted separately, including all four starting orientations of GroEL (dashed lines with different symbols), all four orientations of the ribosome (dotted lines with different symbols), and both orientations of the icosahedral capsid (solid lines with different symbols).

