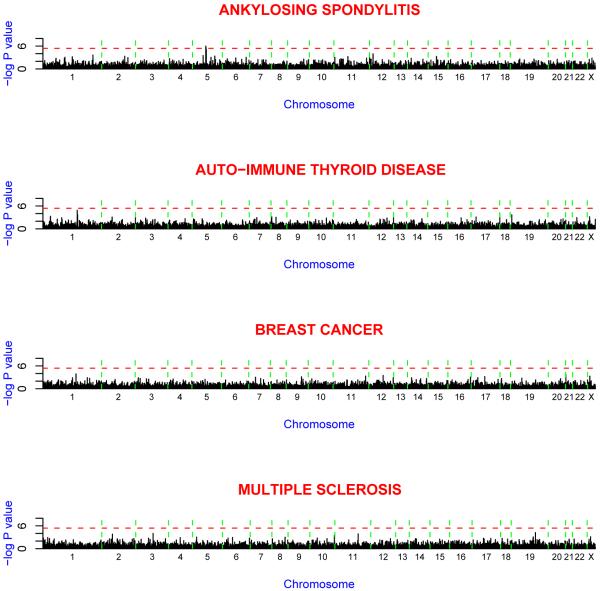
Figure 2.
Minus log10 p values for the Armitage test of trend for genome-wide association scans of ankylosing spondylitis, auto-immune thyroid disease, breast cancer and multiple sclerosis. The spacing between SNPs on the plot is uniform and does not reflect distances between the SNPs. The vertical dashed lines reflect chromosomal boundaries. The horizontal dashed lines display the cutoff of p = 10-6. Note that SNPs within the MHC are not included in this diagram.

