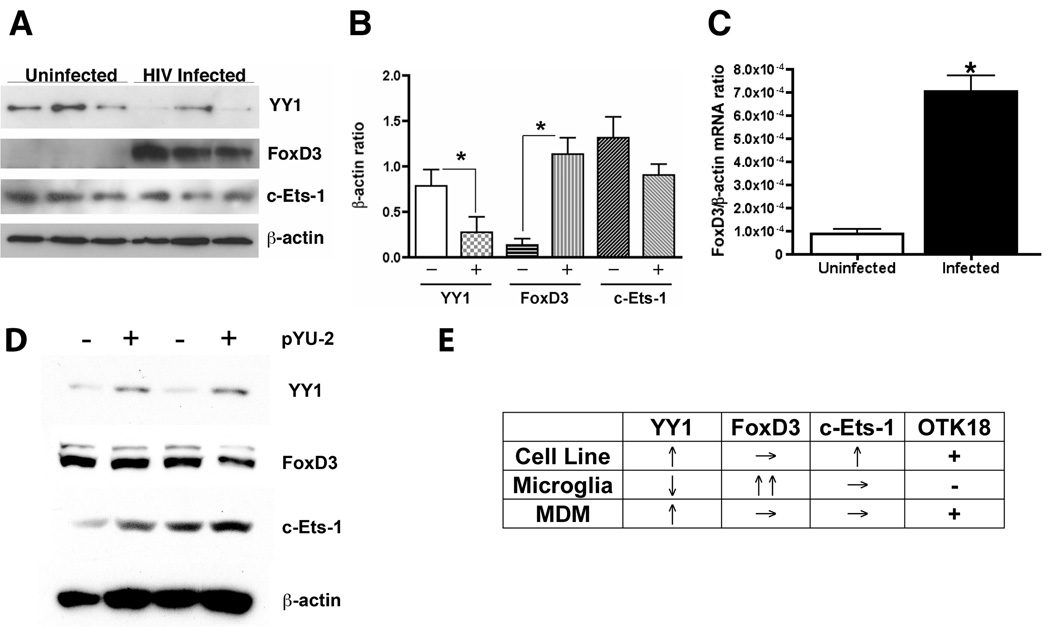
Figure 5. Different induction of YY1 and FoxD3 in human primary microglia.
A, Immunoblotting of transcriptional factors in primary human microglia at 2 days after viral infection (pseudotyped YU2, 2,500 cpm/ml). B, Densitometric analysis of immunoreactive bands and normalization by β-actin band intensity in A (n=3). Uninfected (−) and infected (+) groups were statistically compared by ANOVA and Newman Keuls post-hoc (* denotes p<0.05). C, RT2-PCR analysis of human FoxD3 mRNA levels in uninfected or viral infected human microglia using pre-certified primer sets and probe. Lower ΔCt value is indicative of higher FoxD3 mRNA level in infected microglia. * denotes p<0.01 as determined by Student’s t-test. D, Immunoblotting of transcriptional factors in human monocyte-derived macrophages at 2 days after viral infection (pseudotyped YU2, 2,500 cpm/ml). E, summary of viral gene regulation of transcriptional factors in cell line, primary microglia, and MDM.

