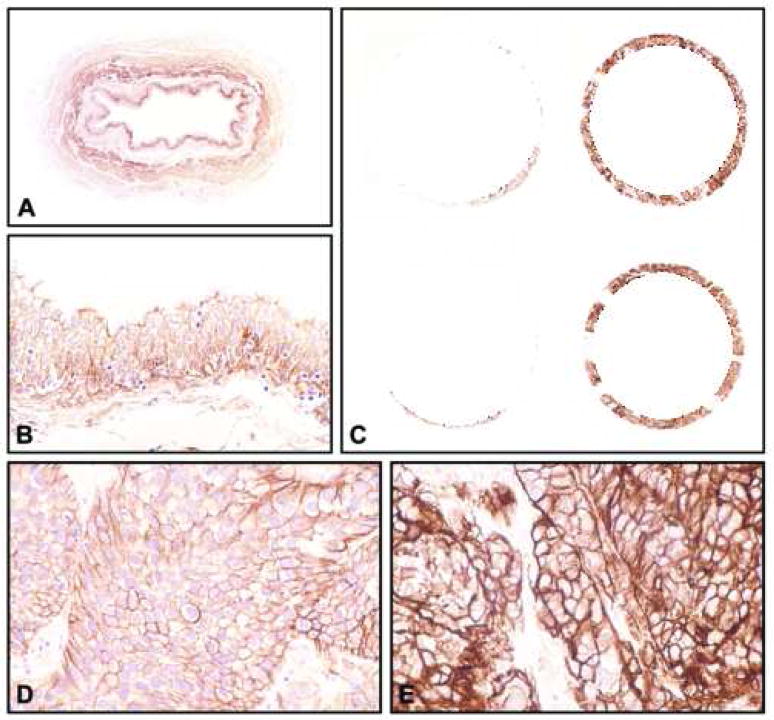
Figure 1.
Expression of EGFR tested in a tissue microarray containing samples of 248 bladder tumors. (A and B) Baseline expression levels in normal urothelium (A, x8; B, x200). (C) Low power view of representative tissue cores corresponding to high-grade (Grade 3) invasive (T1b-T4) TCC with low (left column) and high (right column) levels of EGFR (x18). (D) Higher magnification of a tissue core shown in C with low levels of EGFR (x400). (E) Higher magnification of a tissue core shown in C with high levels of EGFR (x400). Note that low expression levels of EGFR are similar to its baseline expression in normal urothelium.

