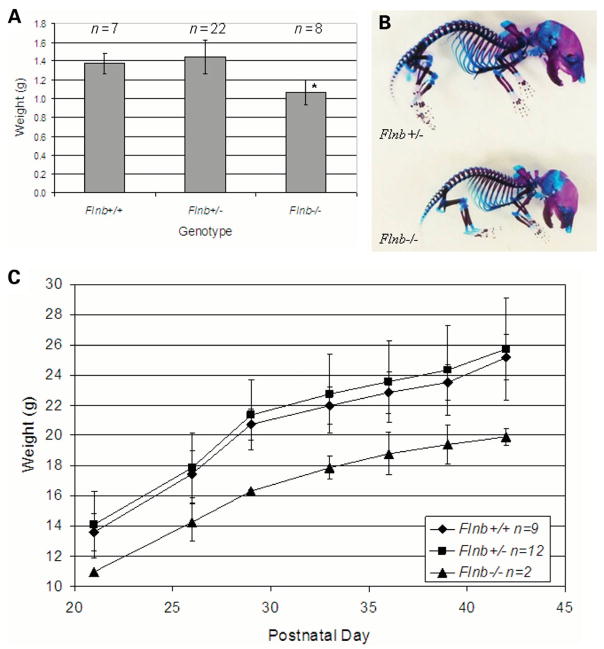
Figure 5.
(A) Graphical representation of the weights of newborn mice compared with their genotypes. *P < 0.05. (B) Skeletal preparation of newborn mice. Bone is stained with alizarin red S and cartilage is stained with alcian blue. (C) Graphical representation of the weights of male mice from postnatal day 21 over a 3-week period compared with their genotypes.

