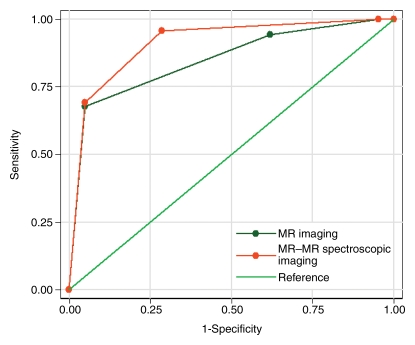
Figure 5:
Graph shows comparison of ROC curves for MR imaging and combined MR imaging and MR spectroscopic imaging scores in differentiating between clinically insignificant and significant PCas defined at pathologic examination; AUC for MR imaging score was 0.85, AUC for combined MR imaging and MR spectroscopic imaging score was 0.91.

