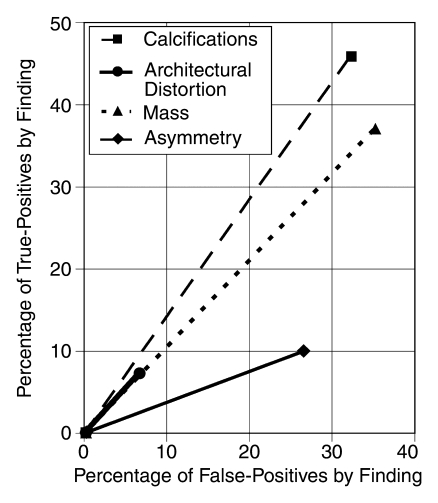
Figure 2:
Graph shows relative efficiency of each finding among all mammograms, plotting finding-specific percentage of true-positive results versus finding-specific percentage of false-positive results. The steeper the line, the more predictive the finding is of cancer. Asymmetry is the least predictive finding.

