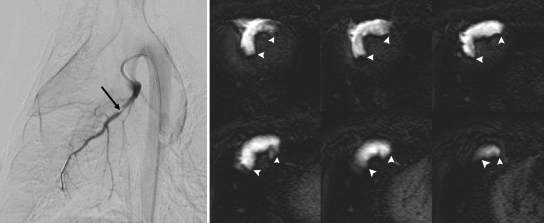
Figure 2:
Angiogram and DE MR images show the use of an x-ray and MR system for catheter placement with x-ray fluoroscopy in LAD and quantification of the embolized territory with MR imaging. Left: LAD coronary angiogram. Tip of the 3-F coronary catheter is seen distal to the first diagonal (arrow). Right: Selection of DE MR images (20 images in total covering the LV) obtained after selective injection of 6 mL 10% gadoterate meglumine into LAD. Hyperenhanced territory (arrowheads) demonstrates LAD perfusion territory. Slow delivery of embolic agent was performed 10 minutes after defining the LAD territory.

