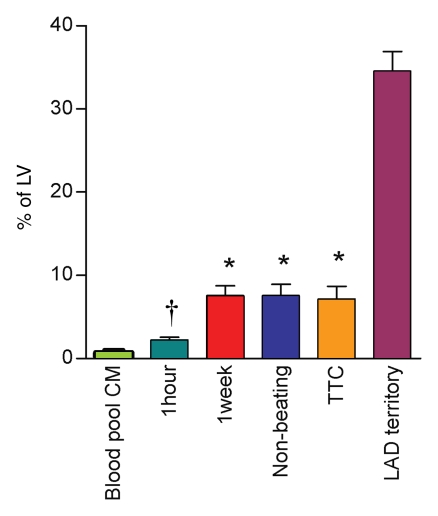
Figure 5:
Microinfarction size in percentage of the LV mass measured on DE MR images after injection of blood pool contrast medium (CM) (green bar) and after injection of extracellular contrast medium at 1 hour (teal bar) and 1 week (red bar), on high-spatial-resolution MR images in nonbeating hearts (blue bar), and at TTC staining (orange bar). The LAD perfusion territory in percentage of the LV (purple bar) is shown for comparison. There was no significant difference between MR imaging measurements at 1 week in the beating heart and MR imaging measurements in the nonbeating heart or measurements at TTC staining. * = P < .05 compared with 1 hour. † = P = .03 compared with the extent after administration of blood pool contrast medium. Error bars = standard errors of the mean.

