Figure 6:
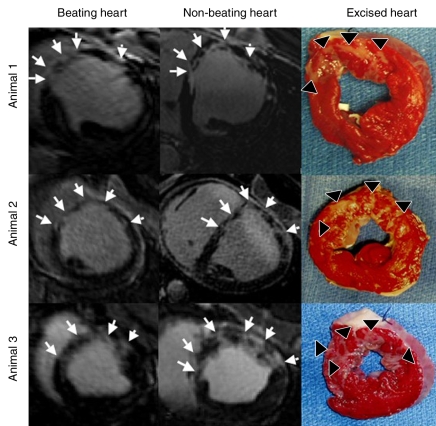
DE MR images (beating and nonbeating hearts) and TTC-stained excised hearts show different patterns of patchy microinfarction in three animals. The microinfarction is patchy with stripes from the endocardium to the epicardium, as shown on MR images (arrows) and at TTC staining (arrowheads).

