
Figure 1.
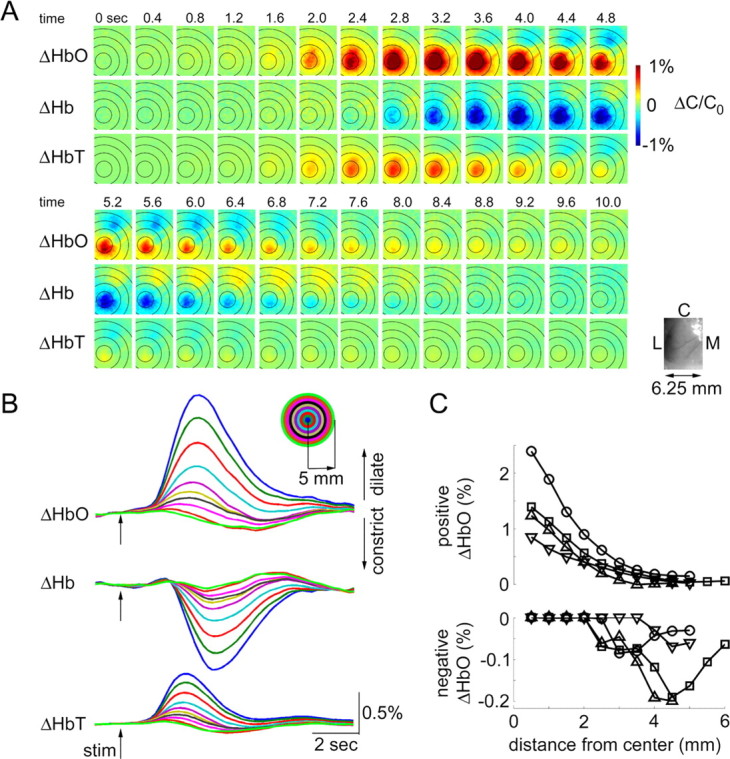
Spectroscopic imaging of blood oxygenation. A, Spatiotemporal evolution of HbO, Hb, and HbT signal change (ΔHbO, ΔHb, ΔHbT) in response to the forepaw stimulus. Time (in seconds) relative to stimulus onset (t = 0) is indicated above images. The time series from the top continues on the bottom. One hundred and fifty trials were averaged. The images were spatially smoothed using a Gaussian kernel of 120 μm full width at e−1 of peak amplitude. The color scale is expressed in percentage of change from the baseline (ΔC/C0). We assumed baseline concentrations of 60 and 40 μm for HbO and Hb, respectively. An image of raw vasculature corresponding to functional frames is shown in lower left corner. L, Lateral; M, medial; C, caudal. B, Signal time courses extracted from 0.5 mm concentric rings around the center of the response. The center was estimated using the earliest HbT response. The rings are superimposed on images in A. Every other ring is shown. The inset shows the color code. C, Peak positive (top) and peak negative (bottom) HbO signal change as a function of distance from the center. Data from four animals are superimposed (circles, squares, upward triangles, and downward triangles).