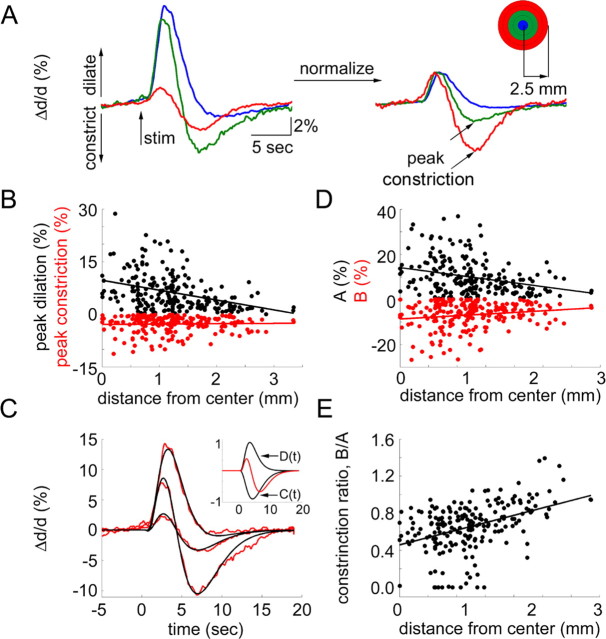
Figure 6.
Arteriolar vasodilatation and vasoconstriction as a function of distance from the center of evoked neuronal response. A, An average of arteriolar diameter changes (Δd/d) within 0.5 mm from the center of neuronal response (blue), in a 0.5–1.5 mm ring around the center (green), and 1.5–2.5 mm ring around the center (red) for one subject. In the right panel, the initial dilation for each ring is normalized to 3%. The inset on the right shows the color code. Dilation and constriction are plotted up and down, respectively. B, Peak dilation (top) and peak constriction (bottom) as a function of distance (in millimeters from the center of evoked neuronal response). Each dot represents a measurement from a single arteriole. Data from seven animals are superimposed. C, Three examples of the fit to the data. The fitting procedure is described in the text. The inset shows the functions C (positive) and D (negative) used to fit the data. The sum of the two normalized by the maximum of the sum of their absolute values is shown in red. D, Linear coefficients A (top) and B (bottom) as a function of distance (in millimeters from the center of the evoked neuronal response). B values are mirrored relative to the horizontal axis for better visualization (they are in fact positive). Data from seven animals are superimposed. E, The ratio of constriction to dilatation estimated as B/A as a function of distance. Each dot represents a measurement from a single arteriole. Data from seven animals are superimposed.

