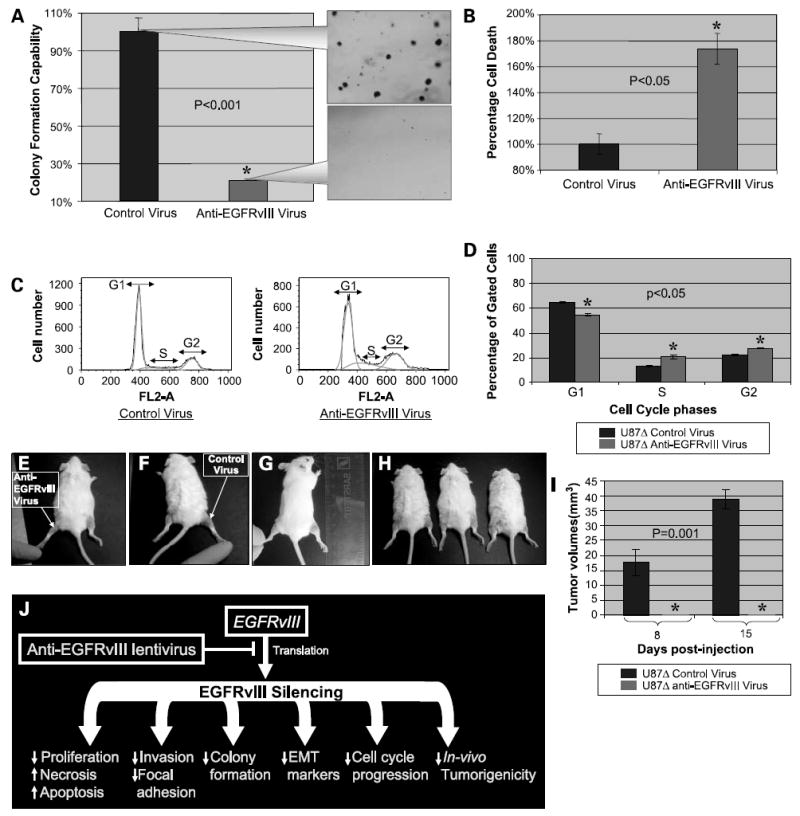
Figure 6. Effects of the anti-EGFRvIII lentivirus on colony formation, cell death, cell cycle progression, and in vivo tumorigenesis of U87Δ cells.

A, anchorage-independent colony formation was evaluated after 3 weeks of exposure of U87Δ cells to anti-EGFRvIII and control viruses. The callout panel illustrates the density of colonies. The mean ± SD of six independent experiments for cells exposed to control virus was considered as 100%. Values for anti-EGFRvIII-treated cells were graphed comparatively. B, rate of necrosis was increased on treatment of U87Δ cells with the anti-EGFRvIII virus in a significant manner (P < 0.05). C, cell cycle progression was evaluated on exposure of U87Δ cells to anti-EGFRvIII virus. A significant decrease was observed in the G1 fraction, but an increase was observed in the S and G2 fractions. D, quantification of cells in each step of cell cycle shows a decrease in G1 and increase in S and G2. Mean ± SD of three independent experiments in percentages (P < 0.05). E to H, in vivo tumorigenicity of U87Δ cells was evaluated on injection of anti-EGFRvIII and control treated U87Δ cells to the flank of SCID mice. E, representative image of the left flank injected with U87Δ cells treated with the anti-EGFRvIII virus. F, representative image of the right flank injected with U87Δ cells treated with control virus. G and H, other test subjects with growth of tumor on the right flank. I, tumors growth was recorded at days 8 and 15 post-injection. At both time points, no growth is observed for the U87Δ cells treated with anti-EGFRvIII virus, whereas the average size of tumors reached an average of 17.5 and 38 mm3 on days 8 and 15, respectively. J, schematic of the biological effect of EGFRvIII silencing on glioma cells. Silencing EGFRvIII reduces proliferation, invasiveness, cell cycle progression, and colony formation capabilities of glioma cells. The EMT markers seem to be repressed significantly on silencing this mutant receptor, reversing the “E-cadherin to N-cadherin switch.” In vivo tumorigenicity of glioma cells is also completely blocked by such treatment.
