Fig. 2.

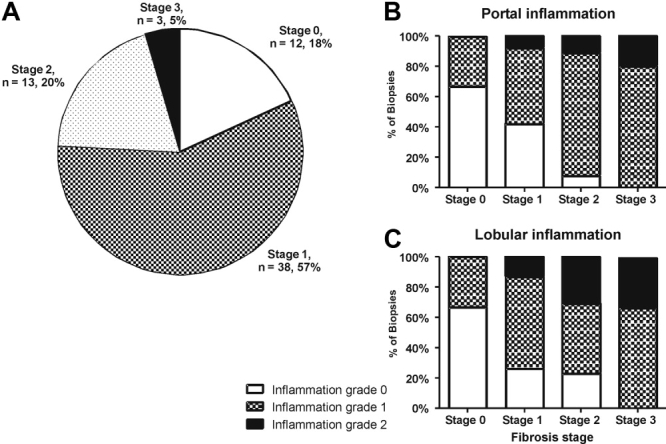
Fibrosis stage and inflammation grade in HCV antibody–positive, HCV RNA–negative subjects (n = 66). (A) Pie chart representation of fibrosis stage by modified Ishak criteria (0–6). (B) Lobular and (C) portal tract inflammation according to stage of fibrosis.
