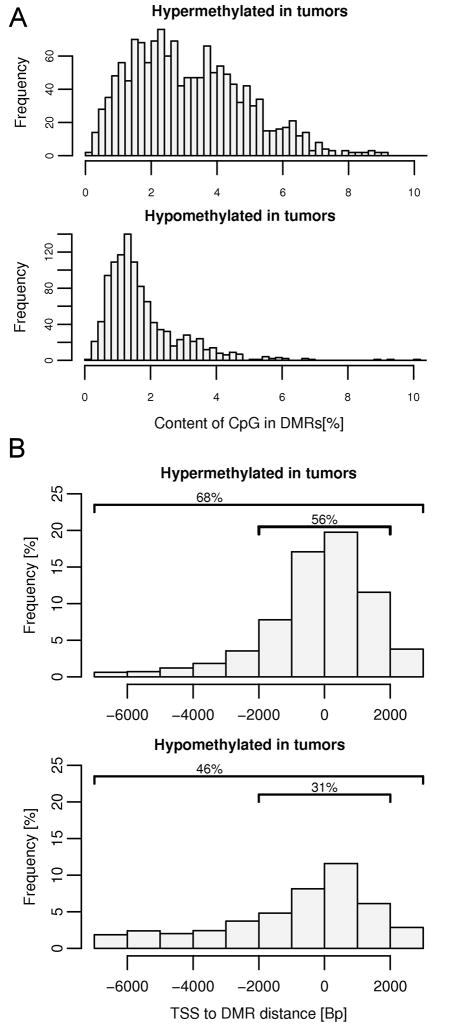
Figure 3.
Characteristics of DMRs. (A) Hypermethylated and hypomethylated tumor specific DMRs differ in CpG content. Regions targeted for hypermethylation in tumor specimens have a higher CpG content than regions of hypomethylation, with 38% of the hypermethylated regions overlap with known CpG islands while only 6% of hypomethylated sequences overlap with CpG islands. (B) Localization of tumor specific DMRs relative to transcription start sites (TSS). Positions of the detected DMRs were compared with the positions of TSS taken from the UCSC genome browser (SwitchGear TSS Track). Overall frequency does not reach 100% since not all DMR detected on the promoter microarray mapped to the known TSS; 32 % of hypermethylated and 54% hypomethylated sites were out of the range that was analyzed (−7kb to +3 kb).

