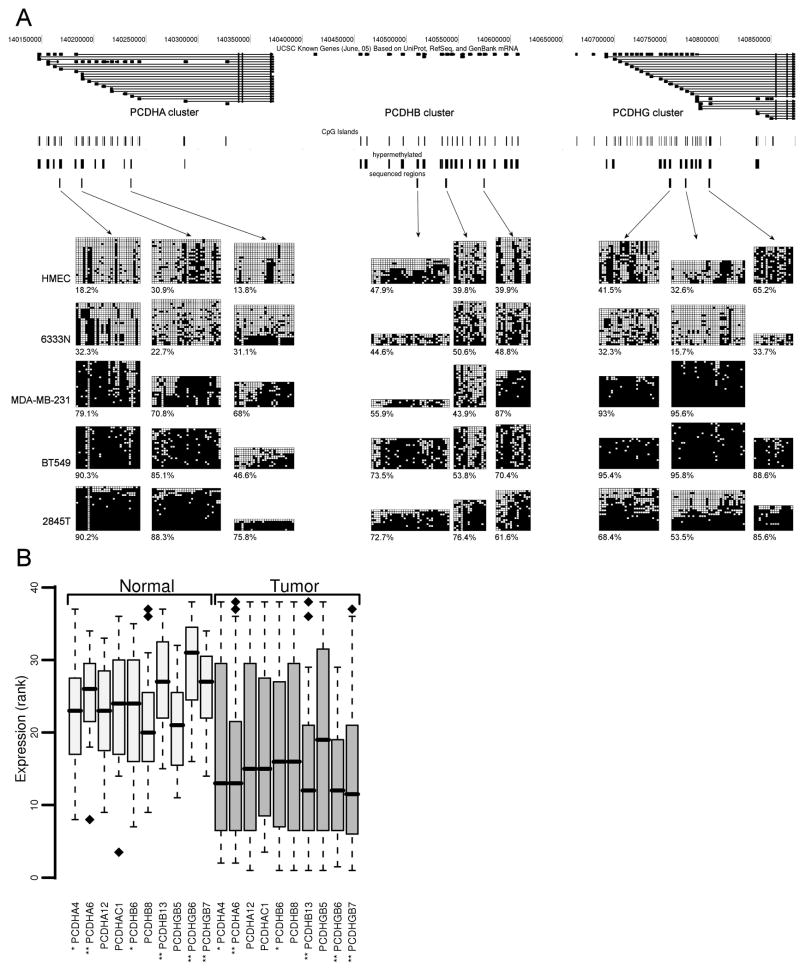
Figure 4.
Aberrant DNA methylation and transcriptional repression of the PCDH cluster. (A) Map of PCDH cluster taken from UCSC Genome Browser (http://genome.ucsc.edu). Individual tracks, from the top to the bottom, show positions of CpG islands, the regions detected as hypermethylated by microarray, and then the regions analyzed by bisulfite sequencing. Below these tracks are the bisulfite sequencing results showing the methylation status of selected DMRs across the PCDH cluster in breast specimens and cell lines. The methylation data obtained by bisulfite sequencing of the samples analyzed are shown. Sample with a suffix “N” is derived from normal tissue and sample with a suffix “T” is derived from tumor tissue. The cell lines shown are the normal cell strain HMEC and the breast cancer cell lines MDA-MB-231 and BT549. In these diagrams, each row represents an individual cloned and sequenced PCR product, whereas the columns contain the data for each of the CpG sites analyzed (■, methylated sites; □, unmethylated sites; ■, poor sequence data). Clones were sorted from least to most methylated for presentation purposes. Results from the three regions analyzed by bisulfite sequencing for each of the gene clusters, PCDHA, PCDHB and PCDHG are shown. The numbers below each bisulfite sequence plots are the percentage of methylated CpG sites for that sample in the region analyzed. (B) Gene expression of the PCDH cluster in normal and breast tumor specimens. mRNA levels of PCDH genes that were bisulfite sequenced were measured using real time RT-PCR. The expression was analyzed in 15 normal and 23 cancerous specimens. For visualization purposes, expression values were converted to ranks. Wilcoxon rank-sum test was used to test whether expression of PCDH genes is higher in normal than in tumor specimens. Significance of change is indicated by each gene name: ** p value <0.05; * p value <0.1. Box plots display 50% of data points and show median, upper, and lower quartiles

