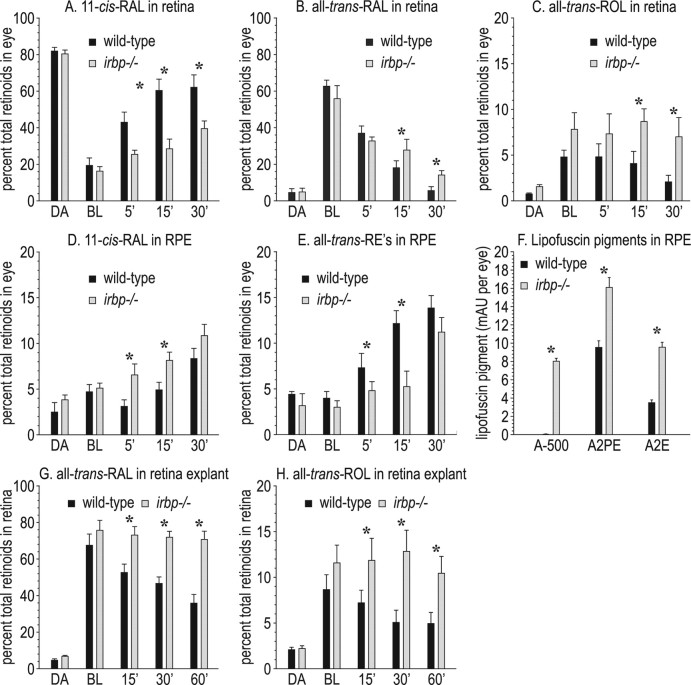
Figure 3.
Retinoid dynamics in retina and RPE from wild-type and irbp −/− mice. A, 11-cis-RAL levels in retinas from mice under the lighting conditions: overnight dark-adapted (DA), immediately postbleach (BL), and at the indicated times in minutes after return to darkness. B, All-trans-RAL levels in retinas. C, All-trans-ROL levels in retinas. D, 11-cis-RAL levels in RPE. E, All-trans-RE levels in RPE. Retinoids are expressed as a percentage of total retinoids per eye. Note the lower 11-cis-RAL, higher all-trans-RAL, and higher all-trans-ROL levels in irbp −/− retinas during postbleach recovery in darkness. Also note the higher 11-cis-RAL and lower all-trans-RE levels in irbp −/− RPE during postbleach recovery. F, Lipofuscin pigments, A-500, A2PE and A2E in wild-type and irbp −/− RPE. Expressed at milli-absorbance units (mAU) per eye. G, Levels of all-trans-RAL in wild-type (WT) and irbp −/− retina explants. H, Levels of all-trans-ROL in WT and irbp −/− retina explants. Retinoids are expressed as a percentage of total retinoids per retina explant. Note the higher all-trans-RAL and all-trans-ROL in irbp −/− explants during postbleach recovery. Asterisks indicate statistically significant differences between wild-type and irbp −/− (p ≤ 0.05). Error bars indicate SDs (n = 4).

