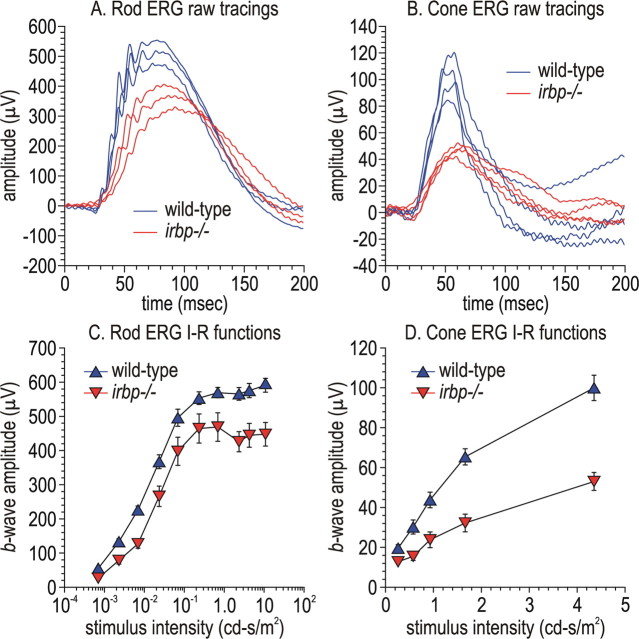
Figure 4.
Electroretinography of wild-type and irbp −/− mice. A, Representative raw ERG tracings of rod responses in three wild-type and irbp −/− mice using stimulus-flash intensities of −2.64 log cd-s/m2. B, Representative raw ERG tracings of cone responses in four wild-type and irbp −/− mice. Data were acquired using stimulus-flash intensities of 0.70 cd-s/m2 with a rod-saturating background light. C, Rod b-wave intensity-response functions in wild-type and irbp −/− mice. D, Cone b-wave intensity-response functions in wild-type and irbp −/− mice.

