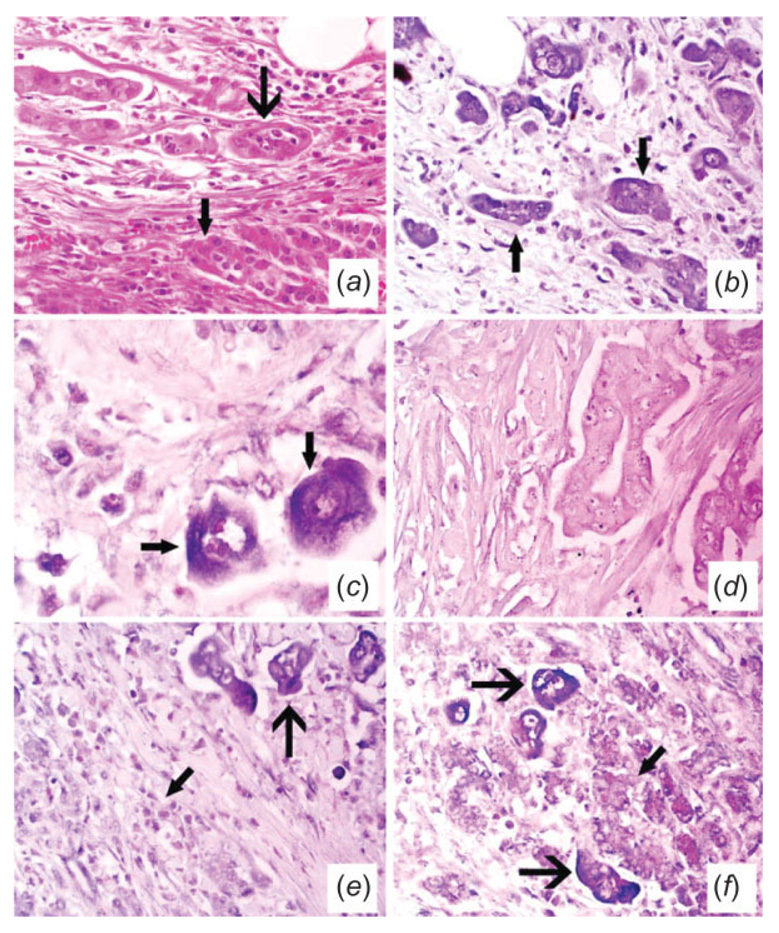
FIGURE 6.
Histologic and molecular analyses of pancreatic cancer for microRNA expression. Panel (a) (×400) depicts the hematoxylin and eosin analysis of a pancreatic adenocarcinoma. The normal pancreatic glands (small arrow) are being invaded by the poorly formed glands of the carcinoma (large arrow). Serial section analysis of miR-221 after in situ amplification of the corresponding cDNA showed that many of the tumor cells contained the target sequence; note the cytoplasmic localization (arrows, panel (b) – ×400 and at higher magnification, panel (c) – ×1,000; the signal is blue due to NBT/BCIP with negative cells counterstained with fast red). The signal was lost with either omission of the primers or substitution with HPV-specific primers (panel (d), ×400). The adjacent serial section also showed many of the tumor cells expressed miR-376a after in situ amplification of the cDNA (e, f). Panel (e) (×400) shows the positive tumor cells (large arrow) and the negative stromal cells in the areas of desmoplasia (small arrow) while panel (f) (×400) depicts the positive tumor cells (large arrow) adjacent to the negative benign pancreatic gland acini (small arrow).

