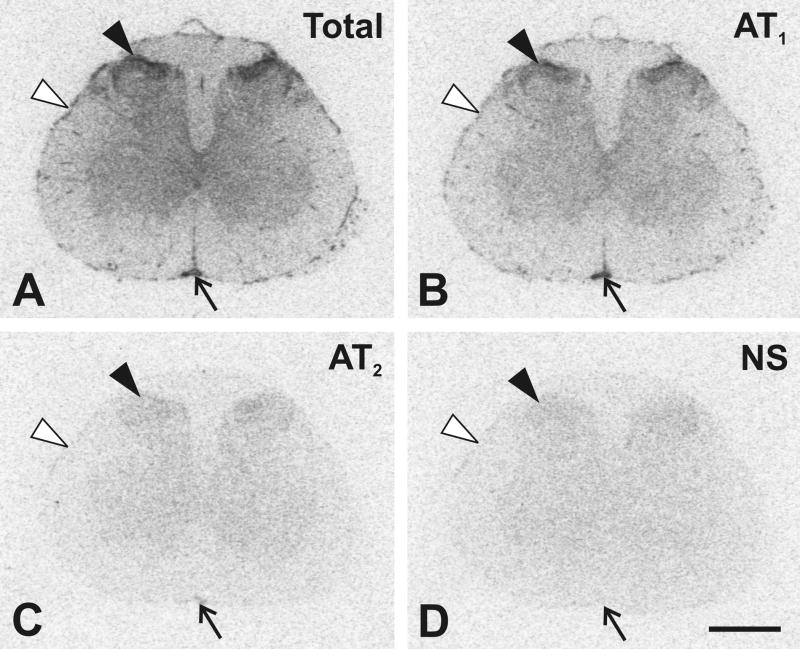
Fig. 1.
Representative autoradiograms showing regional distribution of Angiotensin II receptors in the lower L4 lumbar segment of the spinal cord. (A) Section showing total binding after incubation with [125I]-Sar1-Ang II. Consecutive sections showing binding as in A with addition of: (B) PD123319 to displace binding to AT2 receptors; (C) losartan to displace binding to AT1 receptors; (D) unlabeled Ang II displacing binding to AT1 and AT2 receptors (see Materials and Methods). Black arrowheads point to the superficial dorsal horn of the grey matter. Arrows point to the anterior spinal artery, and white arrowheads point to highly vascularized pia mater. Scale bar = 1 mm. NS, non specific.

