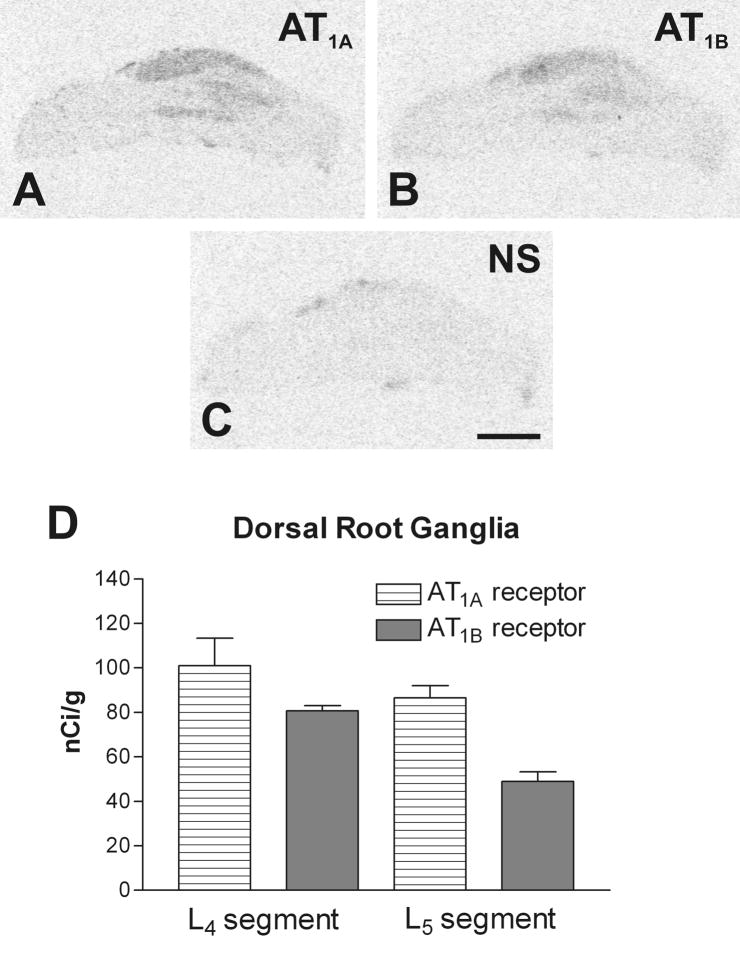
Fig. 5.
Representative autoradiograms showing the presence of Angiotensin II AT1A (A), and AT1B (B) receptor subtype mRNAs in consecutive DRG sections, as revealed by in situ hybridization. (C) The AT1B sense control indicating the level of non-specific hybridization. The AT1A sense probe showed a same level of non-specific signal. (D) Quantitative autoradiography of Ang II receptor types mRNA. Values are means ± SEM (n=5), measured individually as described in Materials and Methods, and expressed as nCi/mg tissue equivalent. Scale bar=1mm. NS, non specific.

