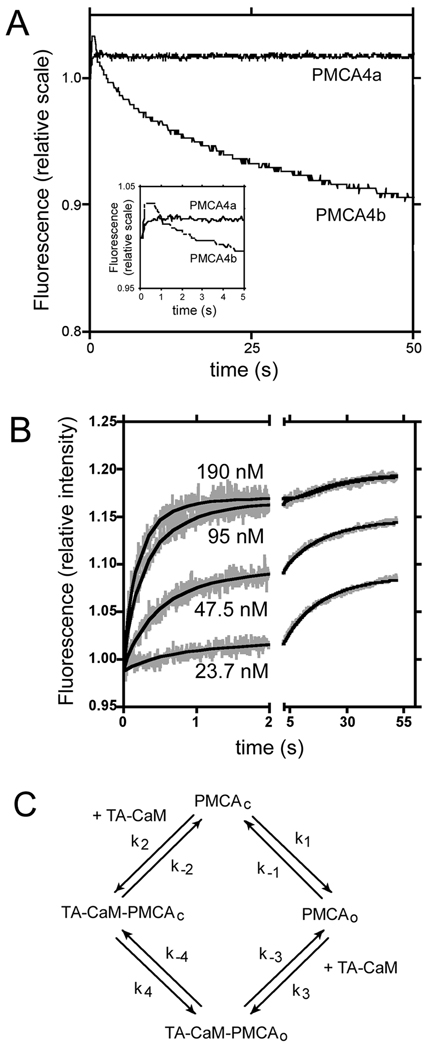
FIGURE 4. Binding of PMCA4a to TA-CaM.
A: Changes of fluorescence in TA-CaM upon mixing with microsomes containing 50 nM of either PMCA4a or PMCA4b. Inset: Traces of the first 5 s of the reaction. B: Changes of fluorescence in TA-CaM upon mixing with microsomes containing the concentration of PMCA4a indicated in the figure. The experimental data are shown in grey. The fit to the model depicted in C is shown in continuous black lines. TA-CaM concentration was 17 nM in all cases. C: Kinetic model that represents the binding of CaM to PMCA4a.

