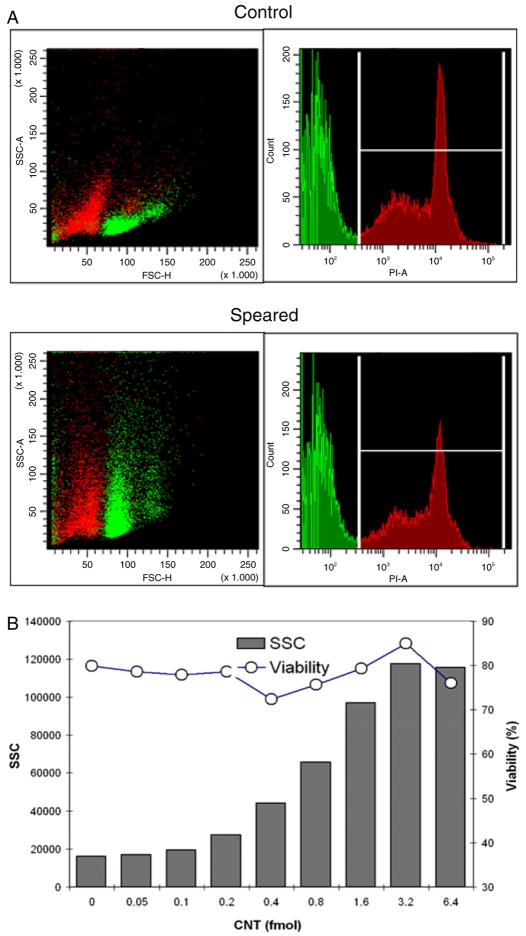
Figure 5.
The viability of CNT associated primary B cells and the SSC dose response to PLL–CNT amount. (a) The population correlation between SSC–FSC scatter plots (left) and PI histograms (right). Each figure represents recordings from 15 000 cells. (b) The dose response of SSC (column) and the cell viability (line) versus PLL–CNT amount. Each data point was extracted from 15 000 primary B cells.

