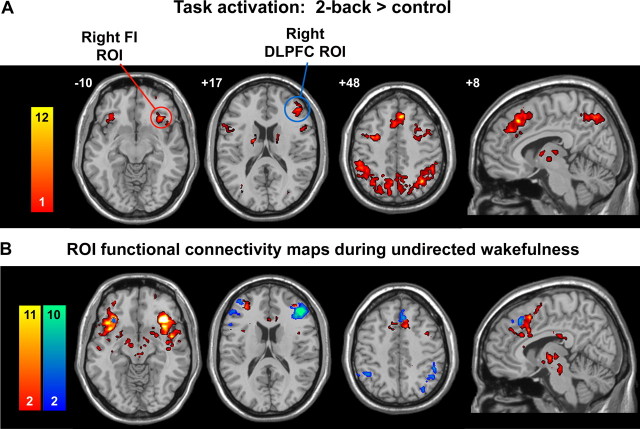
Figure 1.
Disentangling the task-activation ensemble with task-free fcMRI. A, A spatial working memory activation map (two-back minus control) was used to select seed ROIs (circled) within the right frontal lobe. B, Temporal correlations in BOLD signal determined the intrinsic connectivity patterns with the frontoinsular (red-orange colorbar) and dorsolateral prefrontal (blue-green colorbar) ROIs (height and extent thresholds, p < 0.001, corrected) during undirected wakefulness. For display purposes, the t-score color bars in B were adjusted so that the top of the bar reflects the maximum t score seen outside the seed ROI for each network. Effortful tasks like the one used in A often coactivate the networks disentangled using a task-free, intrinsic connectivity analysis in B. These ROI-based maps (B) were used as templates for subsequent independent components analyses (Fig. 2). Functional images are displayed on a standard brain template (MNI). On axial and coronal images, the left side of the image corresponds to the left side of the brain.

