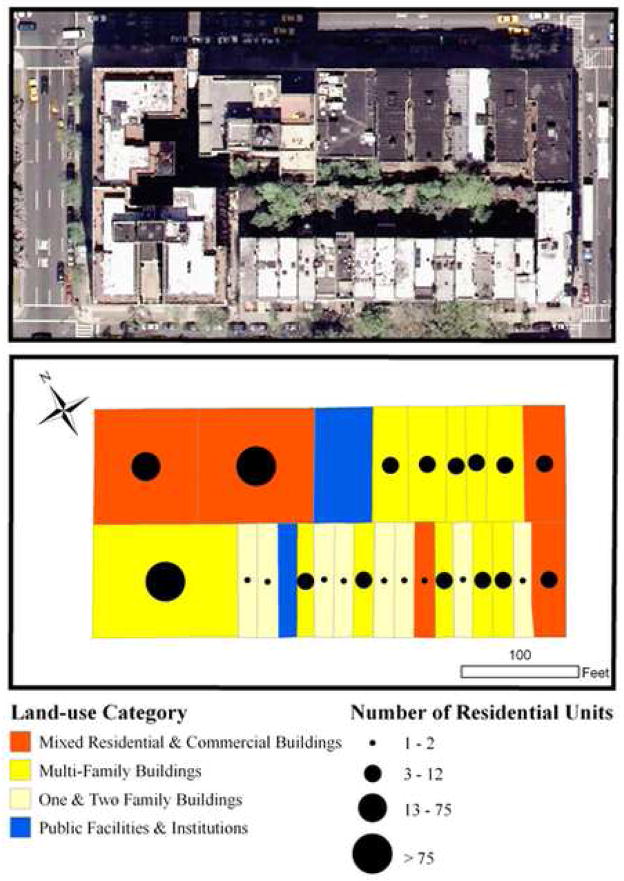
Figure 1.
Heterogeneity of a Manhattan city block. The orthophoto (above) and the cadastral map show the uneven distribution of land use categories and residential units at the tax-lot level even when examining only one city block. (There are, on average, more than 16 city blocks in a New York City census tract.) Data source: NYCMap, 2004; LotInfo 2001.

