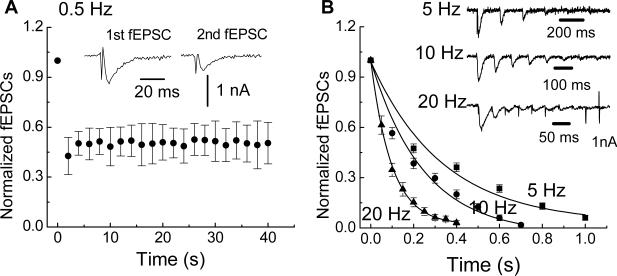
Fig. 1.
Trains of electrical stimulation cause fast synaptic rundown. (A) At 0.5 Hz, the fEPSC declined by 50% after the first stimulus but remained at half amplitude for the remainder of the stimulus train. Data are mean ± SEM (n = 17). Inset shows representative fEPSCs after the first and second stimuli. (B) Stimulus trains at 5, 10 and 20 Hz caused complete fEPSC rundown. Inset traces show representative recordings at each stimulation frequency. The rate of decline in fEPSC amplitude was frequency-dependent and was fitted by a monoexponential decay (solid lines). Symbols in the figure are the mean ± SEM of data obtained from 21 neurons at 5 Hz, 32 neurons at 10 Hz and 19 neurons at 20 Hz.

